TrueProfit Dashboard Gets a Fresh Look: What’s New & What’s Better
This November, we've been working behind the scenes to make your experience smoother, clearer, and more intuitive. The updates aren’t just about looking good—they’re designed to help you manage your eCommerce business with less hassle and more clarity.
Let’s explore what’s new and what’s better.
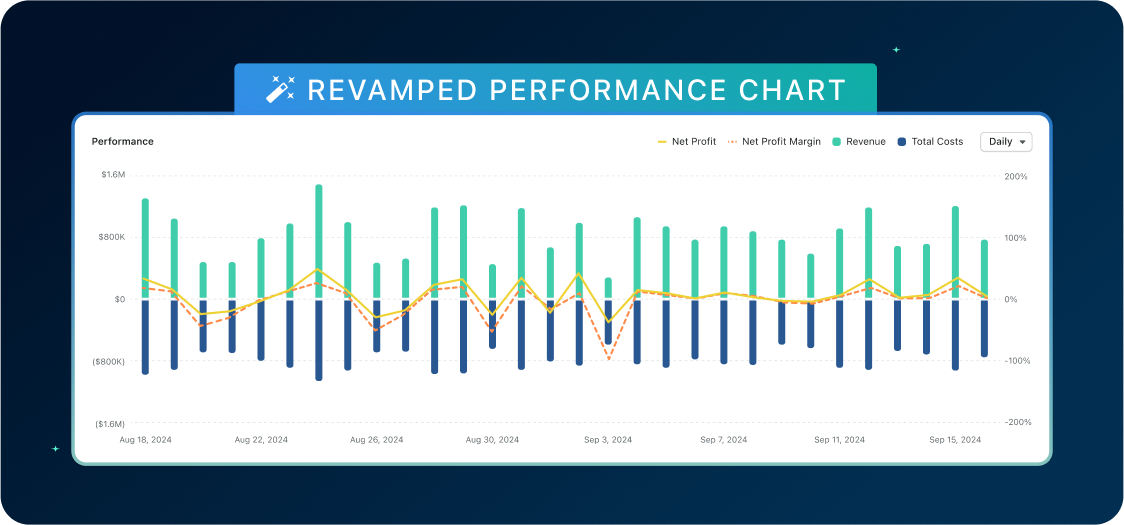
What’s Better: A Smarter, Cleaner Performance Chart
We know how important it is to track and understand your business performance, so we’ve fine-tuned the Performance Chart to give you clearer insights at a glance.
Here’s what makes it better:
- Single scale, big impact: We’ve simplified the Y-axis by using a single scale for all metrics. This means no more juggling multiple scales—just a clearer way to interpret your data.
- More clarity with bars added: By switching Revenue and Total Costs to bars instead of lines, it’s now easier to compare key metrics. The combination of bars and lines helps you quickly spot trends and get clearer insights at a glance.
- Focus on what matters: To keep things simple, the chart now displays 4 fixed metrics only: Net Profit, Net Profit Margin, Revenue, and Total Costs.
Why? By narrowing the focus, it’s easier to spot trends, pinpoint inefficiencies, and focus on boosting profitability without distractions.


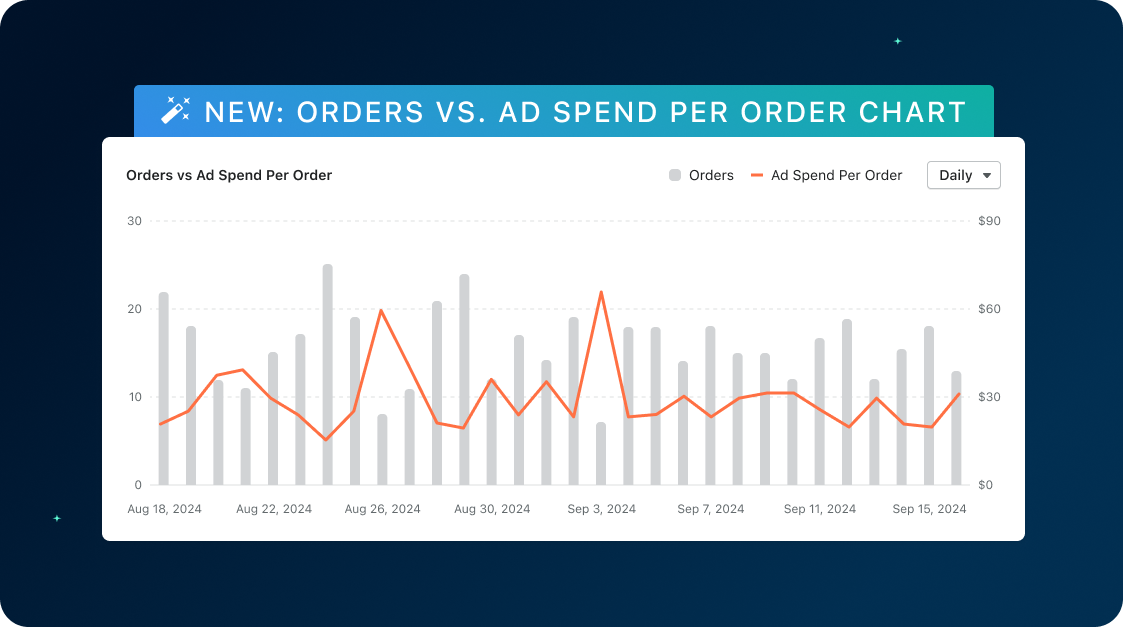
What’s New: Orders vs. Ad Spend Per Order Chart
Say hello to a fresh addition to your dashboard: The Orders vs. Ad Spend Per Order Chart. This new chart gives you a deeper look into how your ad spend translates into orders over time.
Here’s what makes it better:
- Understand Spending Efficiency
Track how much ad spend goes into each order over time to ensure your ad strategy stays cost-effective. - Spot Trends in Orders and Spending
Watch the relationship between your order volume and ad spend, so you can fine-tune your campaigns for better results.
Other small yet mighty tweaks
Sometimes it’s the small tweaks that make your workflow smoother. Here’s a rundown of the updates we’ve made to simplify your dashboard experience:
- Streamlined control: We’ve refreshed the button design to simplify how you adjust time ranges, compare periods, and manage filters, exports, and settings.
- Key metrics always in view: Key metrics (Revenue, Orders, Avg. Order Profit, Net Profit, Net Profit Margin) are now fixed at the top of your dashboard, keeping them always front and center. Still, you can customize your view by adding other metrics below the pinned metrics in the Customize menu.
- Consistent view across all stores: The updated all-store view now mirrors the UI of individual store dashboards. It’s all about providing a cohesive and seamless experience, no matter where you’re looking.
Ready to See the Difference?
Head over to your dashboard and check out the fresh, streamlined look for yourself.
Or, if you’re curious to learn even more, check out our Help Center for additional details to make the most of your new dashboard.
Leah Tran is a Content Specialist at TrueProfit, where she crafts SEO-driven and data-backed content to help eCommerce merchants understand their true profitability. With a strong background in content writing, research, and editorial content, she focuses on making complex financial and business concepts clear, engaging, and actionable for Shopify merchants.


 Shopify profits
