Incremental Margin: Definition, Formula & Calculation (+examples)

Table of Contents
To better understand your profitability and growth, you should calculate your incremental margin to see all the ups and downs with your profitability metrics.
In this guide, we'll help you have a better understanding of what incremental margin is, its formula, an example, and a suggested tool to track your profit margins incrementally.
In this blog:
What is the Incremental Margin?
Incremental margin is how much extra profit a company makes when it sells more. It shows what percentage of the extra money earned (revenue) actually turns into profit after covering costs that change with sales (like materials or labor).
In other words, this metric assesses the impact of changes in sales volume on your profits.

Incremental Margin Formula Is
Or
For example:
- A business sells $100 more of a product.
- After paying for extra costs (like materials and wages), they keep $40 as profit.
- The incremental margin is 40% (because $40 profit ÷ $100 extra sales = 40%).
Monitoring incremental margin helps businesses:
- Measures Profitability: It helps businesses understand how profitable additional sales are.
- Focuses on Variable Costs: Fixed costs are generally excluded since they don’t change with short-term sales increases.
- Better Decision Making: Useful for pricing strategies, budgeting, and evaluating new investments.
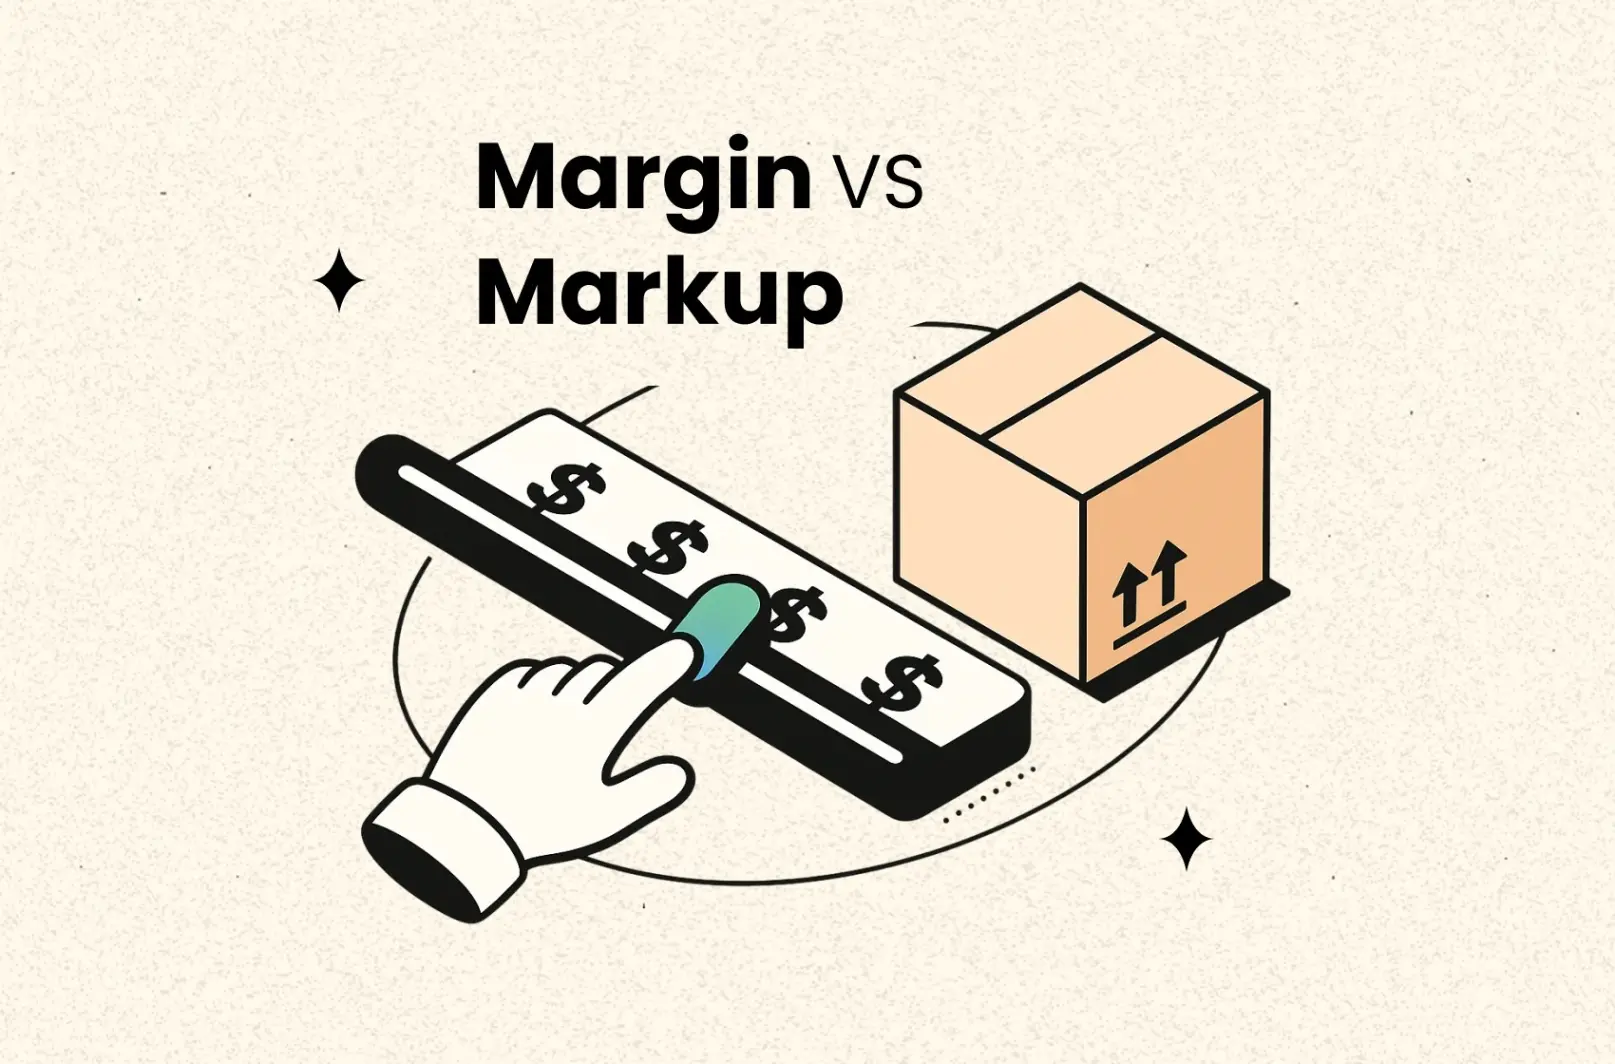
Incremental Revenue vs Incremental Profit vs Incremental Margin: What’s the Difference?
When analyzing business growth, many merchants focus on incremental revenue first. While revenue growth is important, it doesn’t tell the full story. To understand whether growth is actually sustainable and profitable, you need to look at incremental revenue, incremental profit, and incremental margin together not in isolation.
1. Incremental Revenue
Incremental revenue refers to the additional revenue generated compared to a previous period. It answers a simple question: How much more did the business sell?
This metric is useful for measuring growth momentum, campaign performance, or demand changes. However, incremental revenue does not account for costs. A business can generate higher revenue while spending even more on ads, discounts, logistics, or operations, resulting in little to no financial gain.
In short, incremental revenue shows how fast you’re growing, not whether that growth is healthy.
2. Incremental Profit
Incremental profit measures the additional profit earned after accounting for all extra costs required to generate the new revenue. It reflects the real financial outcome of growth.
This metric answers a much more important question: After selling more, how much extra money did the business actually keep?
Incremental profit can increase, stay flat, or even turn negative even when incremental revenue is positive. This often happens when growth relies heavily on paid ads, aggressive promotions, or rising operational costs. That’s why incremental profit is a more reliable indicator of whether growth creates real business value.
3. Incremental Margin
Incremental margin puts incremental profit and incremental revenue into context by measuring the efficiency of growth. It shows what percentage of additional revenue turns into profit.
Rather than focusing on absolute numbers, incremental margin helps you evaluate the quality of growth. Two businesses may generate the same incremental profit, but the one with a higher incremental margin is growing more efficiently and with less cost pressure.
Incremental margin is especially useful for comparing:
- Different time periods
- Marketing campaigns
- Sales channels
- Scaling phases of the business
How Do These Metrics Work Together?
Each metric plays a different role in profitability analysis:
- Incremental revenue tells you how much you’re growing
- Incremental profit tells you how much money you’re actually making
- Incremental margin tells you whether that growth is worth it
Looking at only one of these metrics can lead to misleading conclusions. Strong revenue growth without profit improvement often signals cost inefficiencies, while high incremental margins with low revenue growth may indicate limited scalability.
For ecommerce businesses, growth often comes with rising ad spend, transaction fees, shipping costs, and operational complexity. That’s why focusing on incremental revenue alone can create a false sense of success.
Merchants who track incremental profit and incremental margin alongside revenue are better equipped to:
- Scale winning campaigns confidently
- Cut unprofitable growth early
- Optimize pricing and cost structure
- Make data-driven decisions based on real profitability
Understanding the difference between incremental revenue, profit, and margin helps ensure that growth doesn’t just look good but actually strengthens your bottom line.
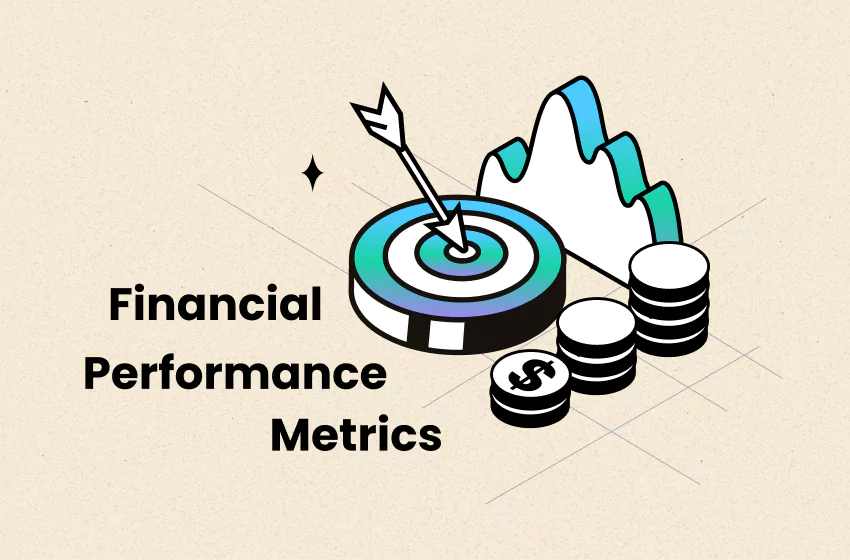
5 Key Profit-related Metrics You Should Track Incrementally
Your business's profit margin shows how much of your revenue remains as profit after covering certain costs. Most profit margins are expressed as a ratio of profit to revenue.
While calculating profit margins alone provide useful insights, calculating incremental margin helps you see how they change as sales increase. This approach gives a clearer picture of how well your business turns additional revenue into profit.
To better understand your company’s financial health, here are five key profitability metrics you should calculate incrementally.
#1. Incremental Gross Margin
Gross profit margin shows how much of your revenue remains after covering the direct costs of producing goods or services (also called cost of goods sold or COGS). It helps businesses understand how efficiently they produce and sell their products.
Here is the formula to calculate your gross profit margin:
Gross profit margin sheds light on the profitability of your company and offers insight into how these expenses are managed because it considers direct expense. A low gross profit margin could be a sign that your COGS is too high or your product pricing is too low.
When tracked incrementally, gross profit margin helps you understand whether new sales are becoming more or less profitable as your business scales.
#2. Incremental Net Margin
Net profit margin shows the percentage of revenue a company keeps as profit after deducting all expenses, including operating costs, taxes, interest, and other expenses. It measures overall profitability and financial efficiency.
The net profit margin formula is:
By factoring in many different costs, it offers you a clearer and more comprehensive picture of your business. Without a doubt, the most significant profitability analysis calculation is the net profit margin.
Looking at net profit margin on an incremental basis helps you measure how changes in revenue and total costs impact profitability over time.
#3. Incremental Operating Margin
Your operating profit margin provides information on the percentage of sales profits your company makes after paying for production but before deducting interest and taxes.
The operating profit margin formula is:
Operating profit margin measures how well you manage your sales, or, more specifically, whether you can generate profits from only your core business’s functions. A low operating profit margin suggests that rather than from the good or service you're offering, the majority of your income comes from some other places.
Incremental operating profit margin highlights whether scaling revenue is strengthening or straining your core business operations.
#4. Incremental EBIT Margin
EBIT margin shows how much profit a company makes from its core operations before paying interest and taxes. It helps measure how efficiently a business runs.
The EBIT margin formula is:
Low EBIT margins represent low business profitability. Investors can decide whether your low EBIT margin results from the competitive environment, where all companies have lower margins, or a problem that only exists within your company, where it is experiencing lower revenues and more costs.
Looking at EBIT margin on an incremental basis helps assess how changes in revenue and operating costs impact profitability before interest and taxes.
#5. Incremental EBITDA Margin
EBITDA margin shows how much profit a company makes from its core operations before subtracting interest, taxes, depreciation, and amortization. It helps measure a company's operating efficiency and cash flow potential.
The EBITDA margin formula is:
In particular, as non-cash expenses are not taken into account in the calculation, it will show whether your company has a good cash flow.
When tracked incrementally, EBITDA margin reveals whether operating efficiency and cash flow improve or weaken as revenue grows.

An Example of Incremental Margin Calculation
Let’s assume that you are in charge of calculating your company's incremental margin from 2024 to 2025.
The financial figures and related profit margins of your business are displayed in the table below.
Metrics | 2024 | 2025 |
|---|---|---|
Revenue | $1,000,000 | $1,200,000 |
COGS | $600,000 | $720,000 |
Gross Profit | $400,000 | $480,000 |
Operating Expenses | $200,000 | $240,000 |
Operating Profit | $200,000 | $240,000 |
Non-Operating Expenses | $20,000 | $30,000 |
EBIT | $180,000 | $210,000 |
Depreciation and Amortization | $50,000 | $60,000 |
EBITDA | $230,000 | $270,000 |
Interest Expenses | $30,000 | $40,000 |
Net Profit | $100,000 | $110,000 |
Now you can apply the incremental margin formula for each of the profit metrics to find out the incremental margins in the period of 2 years, 2024 - 2025.
1. Incremental Gross profit margin = ($480,000 – $400,000) / ($1,200,000 – $1,000,000) = 40%
2. Incremental Net Profit Margin = ($110,000 – $100,000) / ($1,200,000 – $1,000,000) = 5%
3. Incremental Operating profit margin = ($240,000 – $200,000) / ($1,200,000 – $1,000,000) = 20%
4. Incremental EBIT Margin = ($210,000 – $180,000) / ($1,200,000 – $1,000,000) = 15%
5. Incremental EBITDA margin = ($270,000 – $230,000) / ($1,200,000 – $1,000,000) = 20%
Final Thoughts
Incremental margin helps businesses understand whether growth is truly profitable by showing how much additional revenue turns into profit over time. By analyzing changes across gross, operating, EBIT, EBITDA, and especially net profit, merchants can identify where scaling creates real value, and where rising costs quietly erode margins.
For ecommerce businesses, net profit is the most important starting point for any incremental analysis. If your net profit numbers are incomplete or inaccurate, it becomes nearly impossible to evaluate whether growth is actually improving your business. Before worrying about advanced profitability metrics, merchants need a clear view of what they’re really taking home after ads, fees, shipping, and operating costs.
This is where TrueProfit fits in naturally. TrueProfit gives Shopify merchants a real-time, accurate view of net profit by automatically tracking all major costs and revenue across products and channels. With clean net profit data over time, merchants can confidently compare periods, spot profit trends, and make smarter scaling decisions, instead of growing blindly and hoping margins hold.


Irene Le is the Content Manager at TrueProfit, specializing in crafting insightful, data-driven content to help eCommerce merchants scale profitably. With over 5 years of experience in content creation and growth strategy for the eCommerce industry, she is dedicated to producing high-value, actionable content that empowers merchants to make informed financial decisions.