
See TrueProfit in action
Turn today’s insights into tomorrow’s net profit.
Learn why net profit matters — and why TrueProfit does it best.
Table of Contents
(Weekly Updated)
This analysis is based on aggregated profit data from 5,000+ active Shopify stores with recorded revenue greater than $0.
We examined stores across multiple ecommerce business models, including dropshipping, print-on-demand, and self-produced (private label / in-house manufacturing) businesses.
For each store, we analyzed two core profitability metrics:
All profit figures are calculated using real transactional data, factoring in key cost components such as product costs, ad spend, payment fees, shipping, taxes, and all other operating expenses where available.
To ensure accuracy and relevance, all data is refreshed on a weekly basis, allowing the benchmarks to reflect current ecommerce conditions rather than outdated annual averages.
The results presented on this page represent industry-level benchmarks, not performance targets, and are intended to help merchants compare their profitability against similar Shopify businesses operating under real market conditions.
In ecommerce, revenue alone doesn’t tell the full story. Two stores can generate the same sales and end up with completely different outcomes depending on their costs, pricing, and operating efficiency. That’s why profit margin matters far more than top-line revenue.
Based on aggregated data from over 5,000 active ecommerce stores from Jan 2025 to Feb 2026, here’s what healthy profit margins typically look like.
A gross profit margin between 60% and 70% is widely considered the sweet spot for sustainable ecommerce growth.
Most profitable stores today operate around 60–65% gross margin. At this level, businesses usually have enough room to handle fluctuating ad costs, shipping increases, refunds, and platform fees without seeing profits disappear overnight.
Here’s how different ranges tend to perform:
This range matters because ecommerce costs are never static. Advertising performance shifts, fulfillment becomes more expensive, and operational fees add up. A 60–70% gross margin gives businesses the breathing room they need to grow without constantly fighting margin pressure.
Net profit margin shows what you actually keep after all expenses are paid, including ads, product costs, payment processing, apps, shipping, refunds, and overhead.
For most ecommerce stores, a net profit margin between 15% and 25% represents a healthy, scalable business.
Stores earning less than 15% net profit often struggle to grow sustainably. At that level, profitability depends heavily on volume, and there’s very little room for mistakes or rising costs.
Stores consistently earning above 25% usually have strong operational control, effective pricing strategies, or a well-established brand that supports premium margins.
In real-world terms, ecommerce businesses that maintain net margins in the 15–25% range tend to scale with far less stress. They’re growing on actual profit, not just revenue, which makes a huge difference in long-term stability.
Profit margins don’t fluctuate by accident, they change because every ecommerce niche operates under a different cost structure and competitive reality. While two stores might generate the same revenue, their bottom lines can look completely different depending on the industry they’re in.
Here are the core factors that cause profit margins to vary across ecommerce industries:
Some products are simply cheaper to make relative to their selling price. Accessories, print-on-demand items, or lifestyle products often have low production costs, while electronics, supplements, or furniture usually come with higher manufacturing and compliance expenses.
The higher your COGS, the tighter your margin becomes before marketing even starts.
Lightweight products cost far less to ship than bulky or fragile ones. Industries dealing with oversized goods, international fulfillment, or special packaging requirements naturally face higher logistics expenses and those costs directly reduce net profit.
Certain niches attract aggressive ad spending, which drives up customer acquisition costs. Beauty, fitness, pet, and home decor are classic examples where crowded markets make paid traffic expensive.
Meanwhile, specialty or hobby niches often benefit from cheaper ads simply because fewer brands are competing for the same audience.
Same product price, very different ad costs.
Returns quietly eat into margins. Apparel struggles with sizing issues, electronics face defect claims, and home goods risk damage in transit. Each return creates multiple losses: shipping fees, refunds, and sometimes unsellable inventory.
Industries with higher return rates almost always see lower net profit margins.
Generic products force sellers into price competition. Branded businesses don’t.
When customers can easily find identical products elsewhere, margins shrink. But when you control branding, packaging, and customer experience, you gain pricing power which is why private-label businesses typically outperform commodity-style stores.
Some industries thrive on repeat purchases like skincare, supplements, pet products, while others rely mostly on one-time sales.
Higher lifetime value means you can afford higher acquisition costs and still remain profitable over time. Low-repeat niches don’t get that luxury.
Every niche carries hidden expenses: compliance, quality control, design work, customer support volume, and fulfillment coordination. The more operational complexity involved, the more margin leakage occurs behind the scenes.
Let’s take a look at the three core profit metrics most ecommerce businesses rely on: gross profit margin, operating profit margin, and net profit margin.
They all measure “profit”, but at very different stages of your business.
Think of them as three layers of reality.
Gross profit margin is the percentage of revenue left after paying for your product itself also known as Cost of Goods Sold (COGS). This usually includes supplier costs, manufacturing, and basic fulfillment.
In simple terms, it answers: “After I pay for the product, how much money do I have left?”
For example, if you sell something for $100 and it costs $40 to source and ship, you keep $60.
That’s a 60% gross profit margin.
Gross margin tells you whether your pricing makes sense and whether your product has enough room to cover ads, tools, and operations later on.
But it stops there, it doesn’t tell you if your business is actually profitable.
Operating profit margin shows how much profit remains after covering your everyday business expenses, things like advertising, software subscriptions, customer support, salaries, and workspace costs.
It answers a deeper question: “After running my store day to day, how much profit is left?”
Using the same $100 sale: After product costs plus ads, tools, and staff, maybe you’re left with $20.
That’s a 20% operating profit margin.
This metric reflects operational efficiency. Two stores can sell identical products at the same price, but the one with better ad performance and leaner operations will always have a stronger operating margin.
Net profit margin is the final bottom line.
It measures how much money you keep after everything is paid including COGS, ads, apps, payment fees, refunds, taxes, and miscellaneous expenses.
In other words, it answers: “How much money do I really make?”
So if that same $100 sale leaves you with $10 after all costs?
That’s a 10% net profit margin.
Many ecommerce stores look great on gross margin but struggle on net profit because marketing, fulfillment, and overhead quietly eat everything away.
That’s why experienced operators don’t obsess over revenue screenshots or product margins alone.
Once you understand these three, it becomes much easier to see why profit margins vary so dramatically across different ecommerce industries.
If you’re running a store on Shopify, tracking profit margins manually usually means juggling spreadsheets, ad dashboards, and supplier costs which makes it hard to see your real numbers.
A simpler approach is using TrueProfit to centralize everything in one place and track net profit automatically.
TrueProfit helps Shopify merchants:
Instead of relying on revenue or rough estimates, you get clear visibility into what actually matters: how much profit your store is really making.
These numbers aren’t targets, they’re reference points to help you understand where your store stands compared to similar ecommerce businesses.
Here’s how to use them in a practical way:
Think of these benchmarks as a diagnostic tool. They help you identify what to fix, what to scale, and where your biggest profit opportunities are based on real data from 5,000+ active ecommerce stores, refreshed weekly to reflect current market conditions.

| Industry | Gross Profit Margin (%) | Net Profit Margin (%) |
|---|---|---|
| 66% | 46% | |
| 64% | 44% | |
| 69% | 39% | |
| 52% | 39% | |
| 63% | 39% | |
| 63% | 37% | |
| 66% | 34% | |
| 63% | 32% | |
| 61% | 28% | |
| 62% | 28% | |
| 65% | 26% | |
| 62% | 26% | |
| 72% | 23% | |
| 60% | 22% | |
| 64% | 21% | |
| 50% | 18% | |
| 71% | 15% | |
| 60% | 14% | |
| 67% | 14% | |
| 62% | 10% | |
| 64% | 25% |
| Business Models | Gross Profit Margin (%) | Net Profit Margin (%) |
|---|---|---|
| 66% | 28% | |
| 54% | 25% | |
| 62% | 24% | |
| 68% | 19% |
| Industries | Gross Profit Margin (%) | Net Profit Margin (%) |
|---|---|---|
| 66% | 46% | |
| 64% | 44% | |
| 69% | 39% | |
| 52% | 39% | |
| 63% | 39% | |
| 63% | 37% | |
| 66% | 34% | |
| 63% | 32% | |
| 61% | 28% | |
| 62% | 28% |
| Industries | Gross Profit Margin (%) | Net Profit Margin (%) |
|---|---|---|
| 62% | 10% | |
| 67% | 14% | |
| 60% | 14% | |
| 71% | 15% | |
| 50% | 18% | |
| 64% | 21% | |
| 60% | 22% | |
| 72% | 23% | |
| 62% | 26% | |
| 65% | 26% |
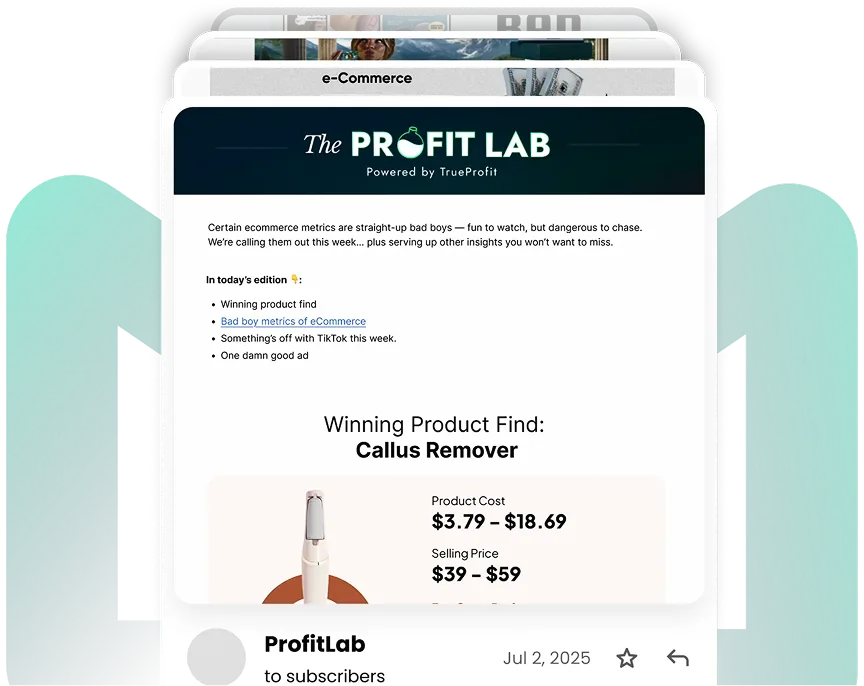
Beyond the benchmark:
How to earn big fat profits
Get battle-tested insights that lead to higher profit — delivered weekly to your inbox.
You’ve seen the benchmarks.
Now see your own numbers.
Track gross margin, net profit, and true product profitability, automatically.


