Multi-Touch Attribution and Models: A Complete Guide [2026]
![Multi-Touch Attribution and Models: A Complete Guide [2026]](https://be.trueprofit.io/uploads/Multi-Touch-Attribution-2.png)
Table of Contents
Multi-touch attribution (MTA) is a marketing model that assigns credit to multiple touchpoints in a customer's journey before a purchase. Instead of giving all credit to just the first or last interaction, MTA distributes value across different channels such as ads, emails, and social media. This helps businesses understand which touchpoints contribute most to conversions.
In this guide, we’ll break down what multi-touch attribution is, how it works, its benefits and limitations, and how you can apply it to your business.
In this blog:
What is Multi-Touch Attribution?
Multi-touch attribution is a marketing measurement model that assigns credit to multiple touchpoints in a customer’s journey before they convert.
Unlike single-touch attribution, which only credits the first or last interaction, multi-touch attribution distributes value across different channels and interactions, giving a more accurate picture of what drives conversions.
How Does Multi-Touch Attribution Work?
Multi-touch attribution works by tracking and analyzing customer interactions across various channels. These interactions may include paid ads, organic search, social media, email campaigns, and direct website visits.
By using attribution models, businesses can assign weight to each touchpoint based on its influence in driving conversions. Some models distribute credit equally, while others prioritize specific interactions like the first or last touch before conversion.
Why Use Multi-Touch Attribution?
Using multi-touch attribution offers several benefits for e-commerce businesses:
1. Improve Budget Allocation
Multi-touch attribution helps e-commerce merchants identify the most effective marketing channels, ensuring that ad spend is directed toward campaigns and platforms that drive actual conversions. This prevents wasted resources on underperforming channels and maximizes return on investment.
2. Enhance Customer Journey Insights
By tracking multiple touchpoints, businesses gain a clearer picture of how customers interact with their brand before making a purchase. This allows for better personalization and optimized marketing messaging at every stage of the buyer's journey, increasing engagement and conversion rates.
3. Increase ROI
With a more accurate understanding of which channels contribute most to sales, businesses can allocate their budgets effectively, refine ad creatives, and enhance retargeting strategies, leading to higher conversion rates and improved profitability.
4. Optimize Marketing Strategies
Instead of relying on assumptions, multi-touch attribution provides real data on what’s working and what’s not. E-commerce merchants can test different marketing approaches, identify the most successful tactics, and scale them for better performance.
5. Reduce Dependence on Guesswork
Many businesses make decisions based on intuition rather than data. Multi-touch attribution removes uncertainty by using actual customer interaction data, leading to more informed and strategic marketing decisions.
6. Support Data-Driven Decision Making
With comprehensive insights, businesses can continuously refine their marketing strategies, improve customer acquisition efforts, and increase overall sales by focusing on the most influential touchpoints.
What Is The Difference Between Single Source And Multi-Touch Attribution?
The "last click/last touch" or "first click/first touch" attribution model, also known as the single source attribution model, gives one touchpoint sole credit for a conversion.
It reduces the customer journey to a single crucial interaction either the very first or the very last one that influenced the consumer's choice to make a purchase.
Multi-touch attribution differs from first-touch and last-touch attribution because it doesn't attribute a conversion to the first or last marketing touchpoint a customer experiences before converting.
Let's compare these two primary single-source attribution model categories with the multi-touch attribution model in more detail:
Stages | Multi-Touch Attribution Model | First Click Attribution Model | |
|---|---|---|---|
Touchpoint Credits | Distribute credit among all touchpoints in accordance with the model defined | 100% credit to the first touchpoint | 100% credit to the last touchpoint |
Setup Process | A challenging attribution model to adopt as it typically requires a strict 5-step process to implement. | Simpler to implement than the multi-touch attribution model. | Simpler to implement than the multi-touch attribution model. |
Analytics | It offers a clear, comprehensive picture of the customer experience and identifies actions that have an impact on purchases and those that don't. | It gives you insights into the first point of interactions that converts leads. | It gives you insights into the last point of interactions that converts leads. |
What Are The Drawbacks Of Multi-Touch Attribution?
Although they offer more insights than other marketing measurements, multi-touch attribution models are not flawless. There are a few key difficulties you encounter when you work to refine your attribution measurements.
- Lacking in Offline Metrics: MTA is frequently used for campaigns that make use of digital marketing platforms since it tracks consumer behavior (e.g. clicks). This makes it difficult for these models to include offline data, like exposure to a print or television ad.
- Data munging: These models are all limited in their ability to fully reveal the consumer journey. For the most accurate insights, you must therefore use numerous models and then correlate the data from each.
- Poor awareness of outside factors: MTA considers user-level information. Therefore, you lack visibility into external phenomena, such as seasonality, that could influence marketing efforts and conversions without using aggregate data.
- Complexity: Single-source models are much simpler than MTA models. These models may be challenging to set up, administer, and analyze due to their complexity, particularly for businesses lacking sophisticated analytical capabilities.
- Huge data requirements: To be effective, MTA models need a lot of data from several channels. To ensure that all the data from various channels can be effectively integrated and analyzed, you must not only be able to acquire this amount of data but also have reliable data integration methods.
- Possibility of overvaluing less important touchpoints: MTA models run the danger of overvaluing less significant interactions because they spread credit among all touchpoints.
- Time and resource burden: MTA models can be time and resource-consuming because of their complexity and data requirements.
Types of Multi-Touch Attribution Models
Several popular multi-touch attribution models analyze every touchpoint used before conversion. To get you started, here are six of the most popular MTA models with specific multi-touch attribution examples for better illustration.
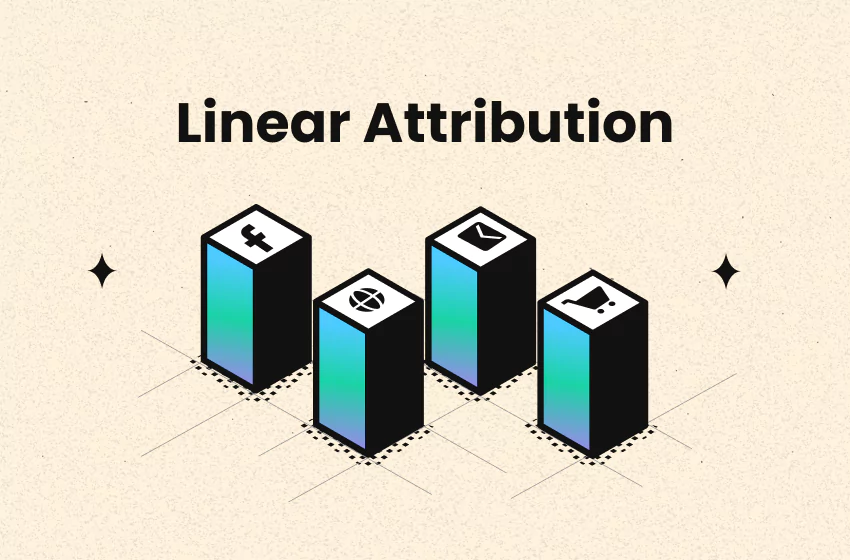
1. Linear Attribution Model


In the linear attribution model, every touchpoint in the buyer's journey receives equal credit for a conversion. Every interaction is valued the same, regardless of its impact.
Example: If a customer interacts with a display ad, an email, a YouTube commercial, and a sponsored post before purchasing, each touchpoint receives 25% credit.
Pros:
- Simple and easy to implement
- Ensures all interactions are recognized
Cons:
- May misrepresent the true impact of each marketing effort
- Doesn’t account for varying influence of touchpoints
2. Time Decay Attribution Model

A time-decay attribution model assigns more credit to the touchpoints that are closer to the conversion, and less credit to the ones that are further away. In short, this model assumes recent interactions are more influential.
Example: If a customer first encounters a display ad but only converts after seeing a sponsored post from an influencer, the influencer’s promotion receives the most credit. A possible distribution might be:
- Native ad on a website: 5%
- Email marketing: 10%
- YouTube commercial: 20%
- Sponsored promotion: 50%
Pros:
- Ideal for businesses with longer sales cycles
- Reflects recency bias in customer decision-making
Cons:
- May not be accurate for businesses with slow decision-making processes
- Undervalues early-stage awareness efforts
3. U-Shaped Attribution Model
In the U-shaped attribution model model, the first and last interactions receive more credit, while middle touchpoints receive less.
Example:
- Display advertisement: 40%
- Native ad: 10%
- Online commercial: 10%
- Sponsored promotion: 40%
Pros:
- Balances awareness and conversion efforts
- Recognizes the role of initiating and closing interactions
Cons:
- May not suit complex customer journeys
- Doesn’t fully account for mid-funnel activities
4. W-Shaped Attribution
The W-shaped attribution model gives significant credit to a mid-funnel lead generation touchpoint. It gives more credit to three key channels that are important for your sales: the first channel that creates awareness, the channel that generates a lead, and the channel that drives conversion.
Example:
- Television commercial: 30%
- Display advertisement: 5%
- Native ad (lead generation): 30
- Email campaign: 5%
- Sponsored promotion: 30%
Pros:
- Highlights key conversion events
- More balanced than the U-shaped model
Cons:
- Can be complex to track and implement
- Still undervalues some touchpoints
5. Full Path Attribution Model
This model gives equal importance to the entire customer journey, assigning credit across awareness, lead generation, opportunity creation, and final conversion.
Example:
- First touchpoint: 22.5%
- Lead generation: 22.5%
- Opportunity creation: 22.5%
- Final conversion: 22.5%
- Other touchpoints: 10%
Pros:
- Comprehensive view of the marketing funnel
- Helps businesses optimize each stage of the customer journey
Cons:
- Requires advanced tracking tools
- Data-heavy and complex to implement
6. Custom Attribution Model
This model is tailored to a business’s specific needs, assigning unique weights to different touchpoints based on data.
Pros:
- Most accurate for unique customer journeys
- Fully customizable to business needs
Cons:
- Requires sophisticated analytics
- Can be difficult to set up and refine
How To Use Multi-Touch Attribution In Your Business Strategy
Setting up multi-touch attribution (MTA) can be challenging due to the complexity of modern customer journeys. People interact with multiple channels, devices, and platforms before making a purchase, making it harder to track their path, especially with increasing privacy restrictions. However, starting early allows you to refine your strategy over time. Here’s how to implement MTA effectively:
Step 1: Choose the Right Attribution Model and Metrics
Select an attribution model that aligns with your business goals. Consider factors like your sales cycle length and the types of campaigns you run.
Once you’ve chosen a model, determine which key performance indicators (KPIs) to track. These eCommerce metrics will help measure the effectiveness of your campaigns and optimize ROI marketing.
Step 2: Build your team
Successful MTA implementation requires collaboration. Identify who will be responsible for collecting and analyzing data—this might include marketing analysts, data scientists, and finance stakeholders. The marketing team should also be involved, as they will use the insights to optimize campaigns.
Step 3: Use marketing analytics tools
Leverage marketing attribution tools to consolidate and analyze data from all touchpoints. Choose a tool that provides person-level data and additional insights, such as the impact of brand awareness and ad copy effectiveness.
Step 4: Analyze the Data
Once you have collected enough data, extract meaningful insights by asking questions like:
- What is the average sales cycle length, and how does it vary by channel?
- Which marketing channels drive the most conversions?
- Are there any recurring barriers to conversion?
- How do different channels influence customer engagement?
By answering these questions, you can identify strengths, weaknesses, and opportunities to optimize your strategy.
For a quick starter, use our free Profit Margin Calculator to track your margins and to know whether your current ad budget makes sense.
Step 5: Keep testing and optimizing
MTA is not a one-time setup, it requires ongoing analysis and refinement. Regularly test different attribution models, adjust marketing budgets based on insights, and optimize campaigns to improve performance over time. The more you refine your approach, the more effective your marketing efforts will become.ces to reach your customers at the ideal moments if you regularly optimize and test your campaigns.
Accurate tracking and flexibility will be essential for your business as markets continue to change and consumer expectations adjust to a new standard. By giving you a more detailed picture of what is and isn't working inside your campaigns, multi-touch attribution promotes the flexibility you need.
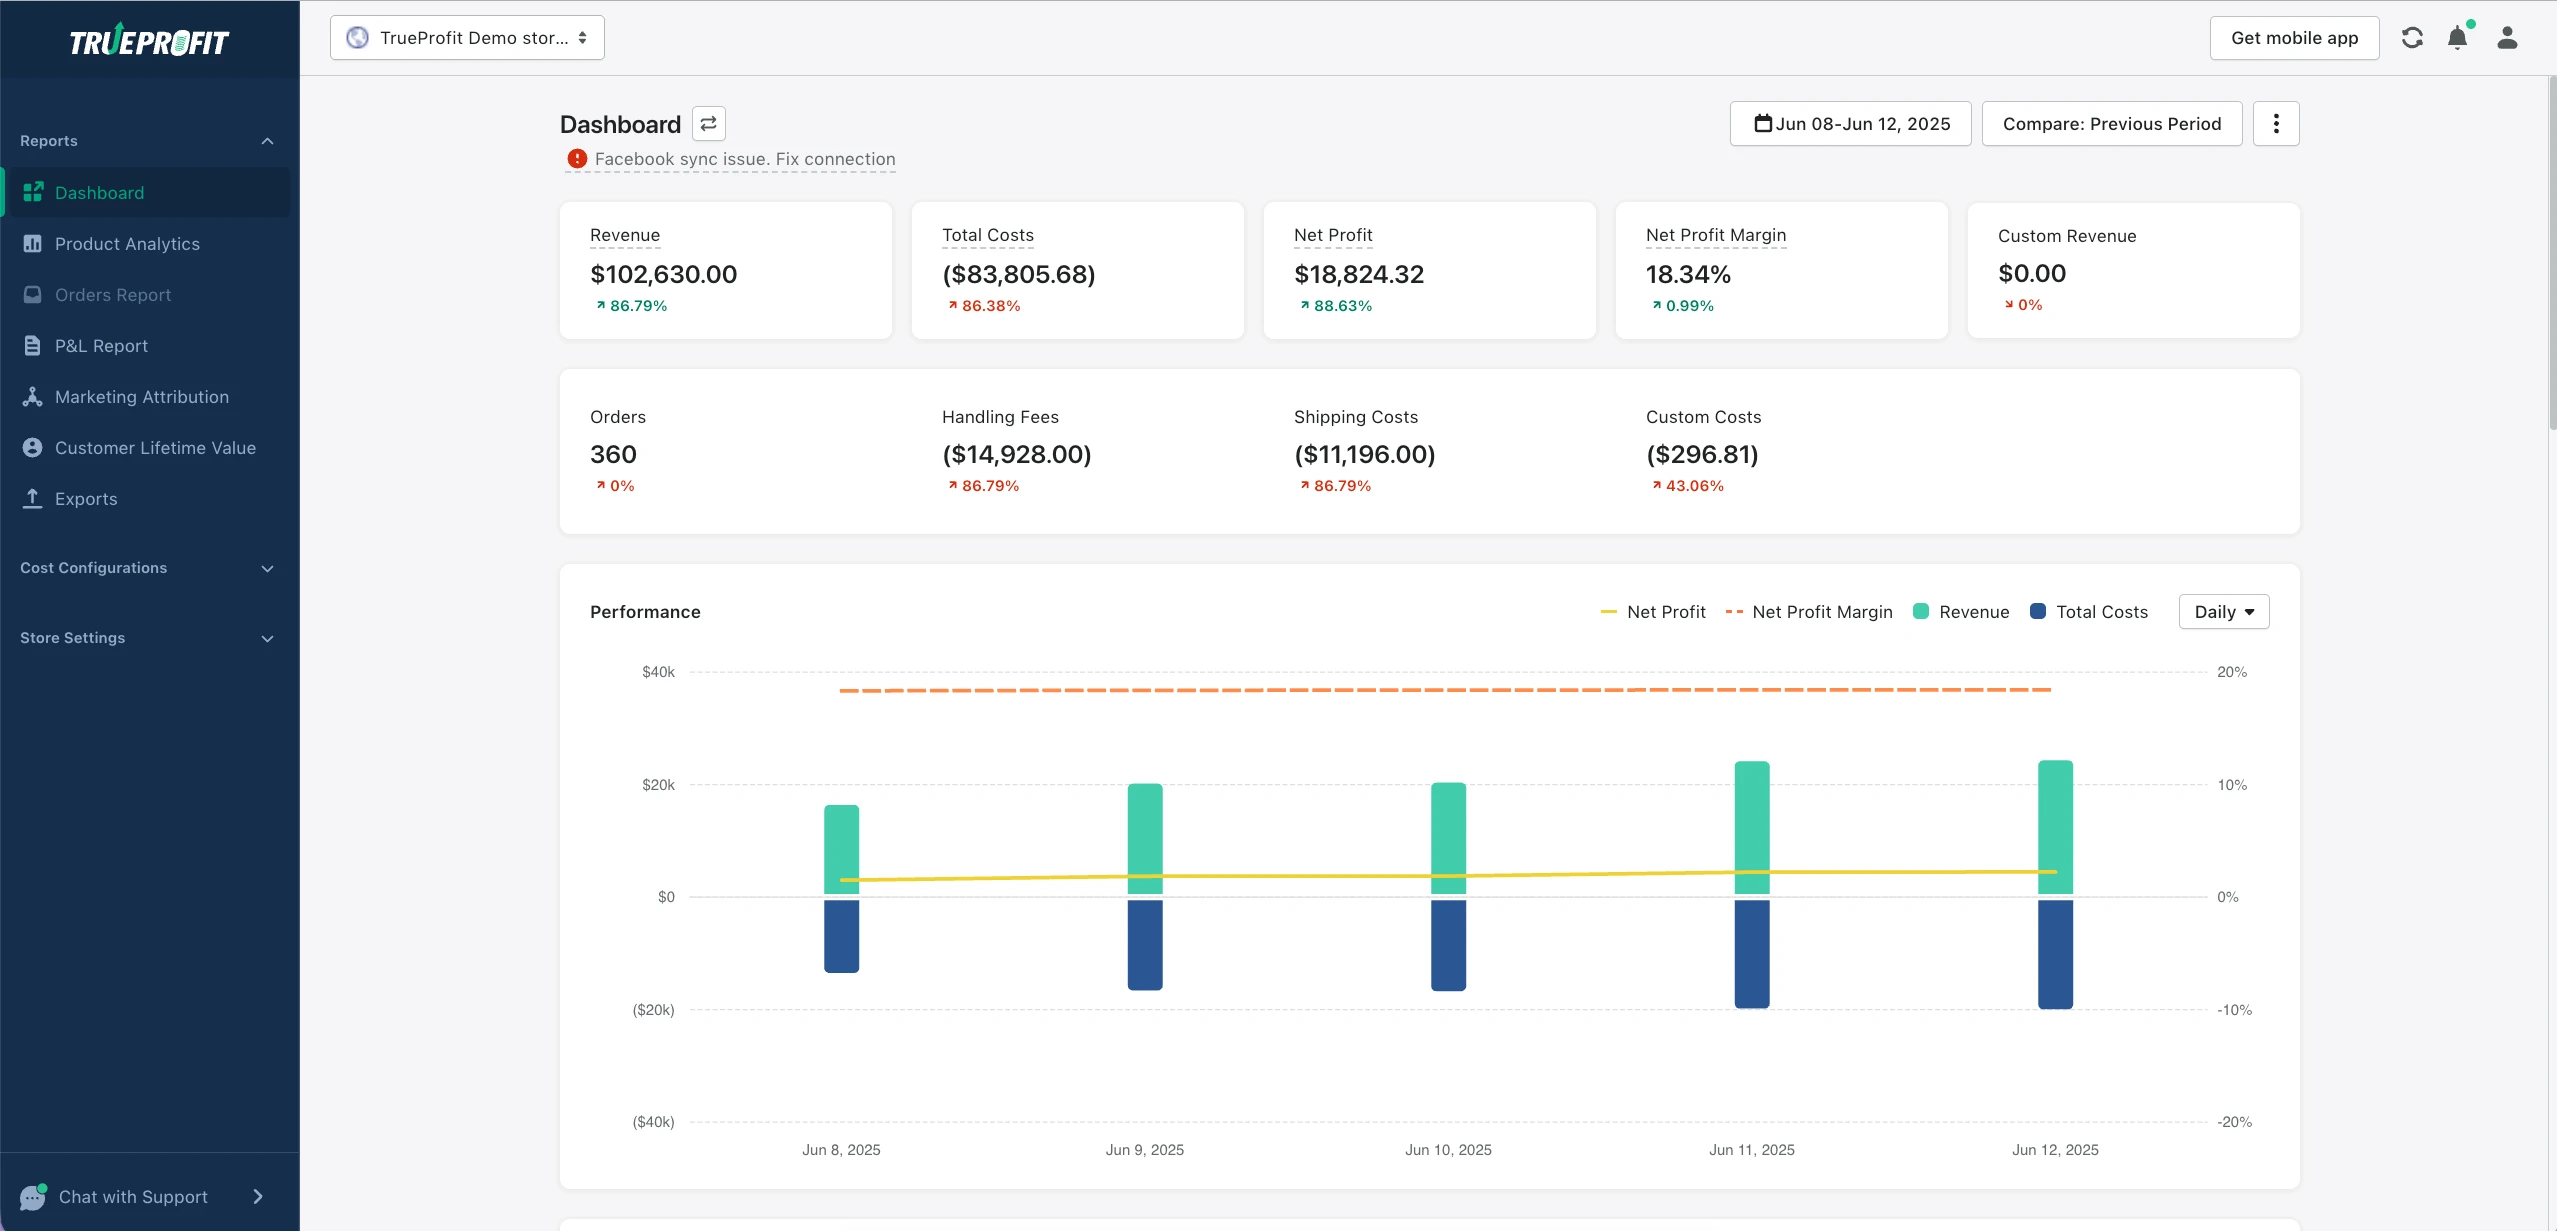
When it comes to accurate tracking, TrueProfit bridges the gap between your ROAS and your actual earnings - net profit. Track your attribution, marketing metrics, and net profit in one place so every dollar spent leads to real, measurable growth.
Multi-touch attribution gives you a more accurate picture of how each marketing channel contributes to conversions. By understanding the full customer journey, you can allocate budget more effectively, optimize campaigns, and drive better ROI.
In today’s complex marketing landscape, multi-touch attribution is key to smarter, data-driven decisions.

Tracy is a senior content executive at TrueProfit – specializing in helping eCommerce businesses scale profitably through content. She has over 4 years of experience in eCommerce and digital marketing editorial writing. She develops high-impact content that helps thousands of Shopify merchants make data-driven, profit-focused decisions.