Google Analytics for Ecommerce Websites: The Complete 2026 Guide
Table of Contents
Google Analytics for ecommerce websites is a free analytics tool that tracks what people do when they visit your store.
Think of it as a live window into your storefront’s traffic and customer behavior, helping you understand what’s working and what needs fixing so you can grow your sales with clarity.
This guide will walk you through how to set up Google Analytics for your ecommerce website. And if you’ve ever felt lost in GA4’s endless charts or unsure how to connect your data to your daily decisions, this guide will tell you what metrics to look at.
Let’s dive in.
In this blog:
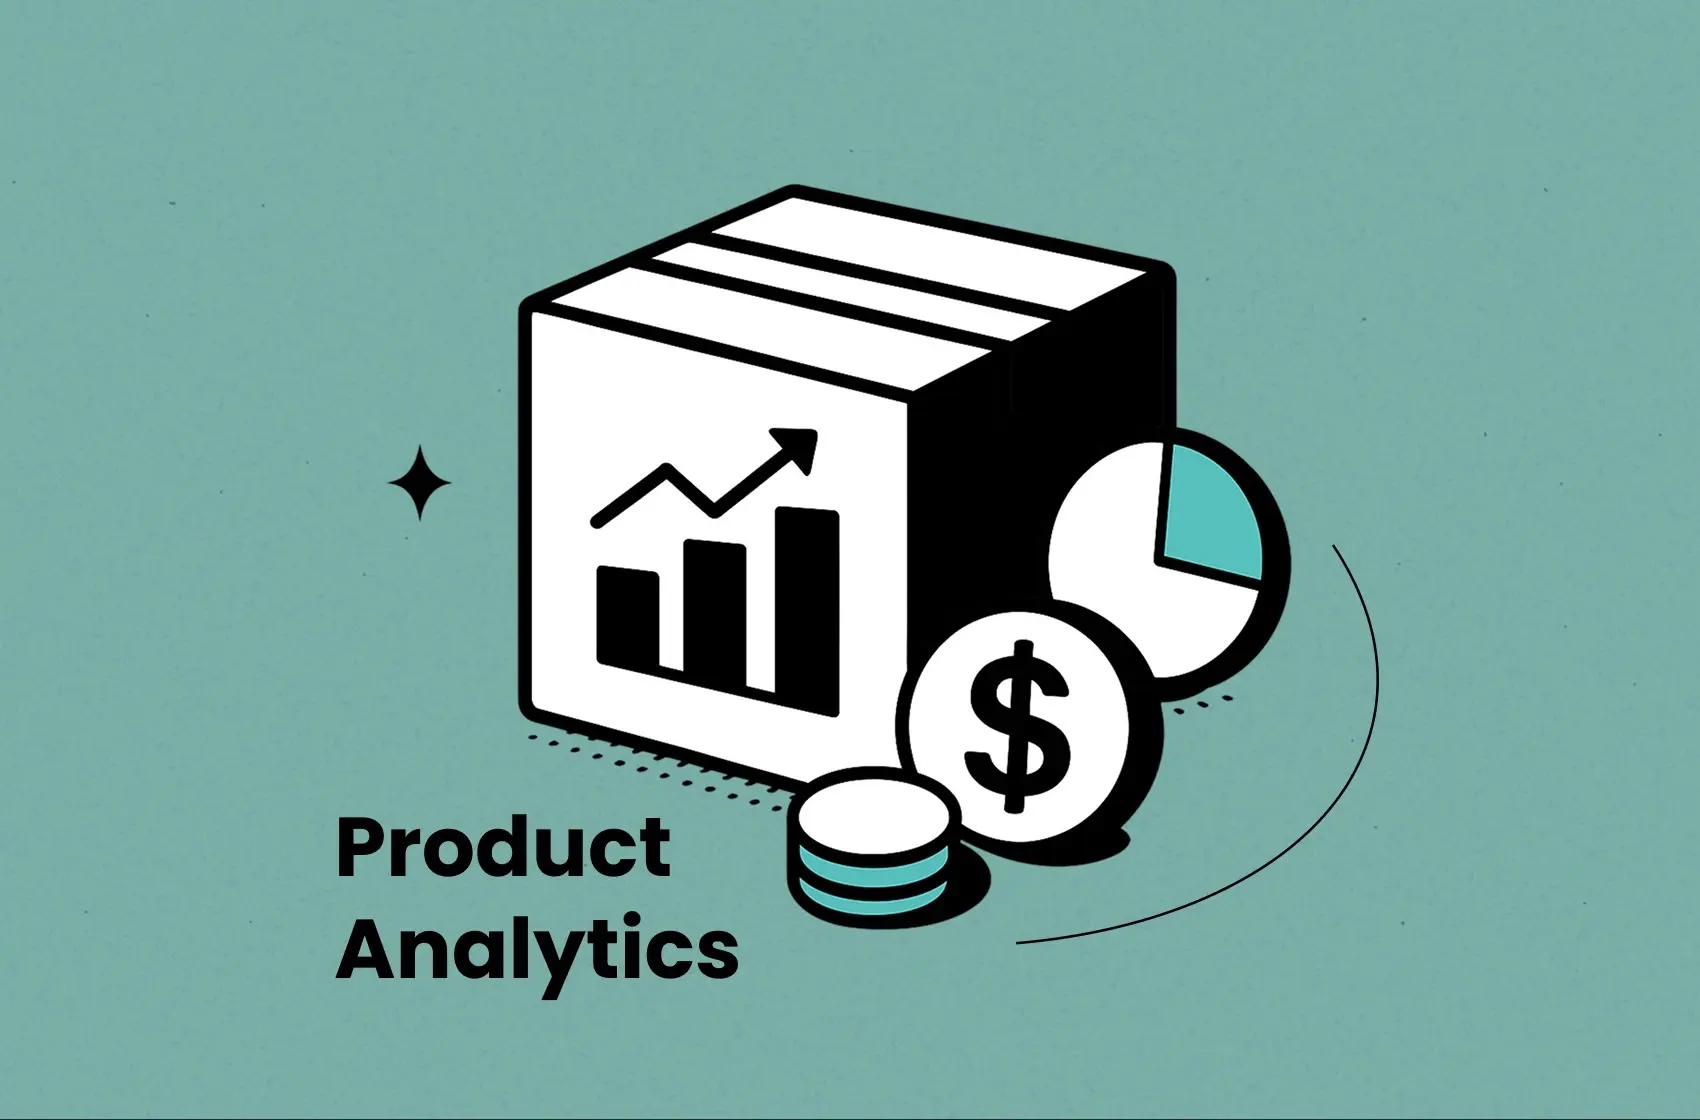
What is Google Analytics for an eCommerce website?
Google Analytics (GA) is a free tool that helps you understand how people find and interact with your online store.
Unlike Google Search Console, which only shows how people find your site through Google’s organic (unpaid) search, Google Analytics looks at everything.
That means it tracks all your traffic sources—organic search, paid search, social, and more—literally where visitors come from and what they do once they land on your site.
GA4 vs. Universal Analytics (GA3): What’s different?
Universal Analytics tracked “sessions” that reset after 30 minutes of inactivity, counting the same shopper as a new session if they returned.
GA4 uses an event-based model, capturing each action—like viewing a product or adding to cart—as an event tied to the same user. This gives you cleaner, more accurate data on how shoppers move through your store.
From now on, when we say Google Analytics, we mean Google Analytics 4 (GA4)—the latest and most accurate version.

How Does Google Analytics Work for eCommerce Websites?
Google Analytics collects data from every visitor on your store using a small JavaScript snippet added to your site. It tracks customer actions and sends this data to your Google Analytics dashboard.
Here’s what you need to know:
Account: Your Google Analytics login. You can add team members for shared access.
Property: Your store. Most sellers track one main property.
Data Stream: The pipeline that sends page views, interactions, and purchase data from your store to Google Analytics.
Events: Google Analytics tracks every action—like viewing a product or completing checkout—as an event.
Reports: Google Analytics organizes your data into 4 reports:
- Acquisition (where visitors come from)
- Engagement (what they do)
- Monetization (sales and revenue)
- Retention (if they come back).
Why is Google Analytics Important for eCommerce Websites?
Google Analytics helps you:
- See your most-viewed products and collections to double down on what converts.
- Find pages that engage shoppers and spot those that need better images or offers.
- Track which landing and product pages turn visitors into buyers.
- Measure which channels (organic, paid, email, social) bring your best customers.
How to Set Up Google Analytics for Your eCommerce Website?
Step 1: Sign Up for Google Analytics
Go to Google Analytics and click Start Measuring.
Create your account, name it (use your store name), and set up your first property for your store.
Select Web as your platform and enter your store URL so Google Analytics knows where to collect data.
When done, you’ll get a Measurement ID (G-XXXXXXXXXX). Keep this ready for connecting Google Analytics to your store.
Step 2: Add Your First Property
After signing in to Google Analytics, create your account to track your store.
Click Next to add your first property (your store).
If you already have a Google Analytics account, go to Admin > + Create Property.
Enter your property details:
- Name (your store name)
- Currency (store selling currency)
- Reporting time zone (match your store’s time zone)
Your reports will use this time zone, even if customers shop from different locations.
Step 3: Configure a Data Stream (If you’re using Shopify)
To set up your data stream for Shopify:.
- Connect your Google account.
Open the app and click Connect Your Google Account. Select the Google account where you created your Google Analytics property. - Link your Google Analytics property.
From the dropdown, choose your Google Analytics property for your Shopify store and confirm the connection.
Step 4: Set Up Conversion Events
The actions shoppers take on your store are called conversion events.
Once you connect Google Analytics, your store will automatically track key ecommerce events, including:
- Page views
- Searches
- Product views
- Add to cart
- Begin checkout
- Add payment information
- Purchases
Step 5: Configure Data Retention Settings
By default, Google Analytics 4 keeps event-level data for two months. This might not be enough if your sales cycle is longer than that.
To keep your data longer:
- Go to your Google Analytics Admin panel.
- Click Data Settings > Data Retention under the property column.
- Change the retention period from 2 months to 14 months.
- Save your settings.
Step 6: Test and Validate Your Google Analytics Data
The easiest way to validate your setup is with the Realtime overview report in Google Analytics. Visit your store in a separate browser tab and:
- Navigate to a product page.
- Search for a product.
- Add an item to your cart.
You should see these actions appear in the Realtime report as you perform them.

Key Ecommerce Metrics to Track in Google Analytics
1. Revenue
To see your revenue in Google Analytics, go to Reports > Life Cycle > Monetization > Overview. This page shows how much money your store made during a set time period.
In Google Analytics, revenue is tracked automatically when a customer completes a purchase.

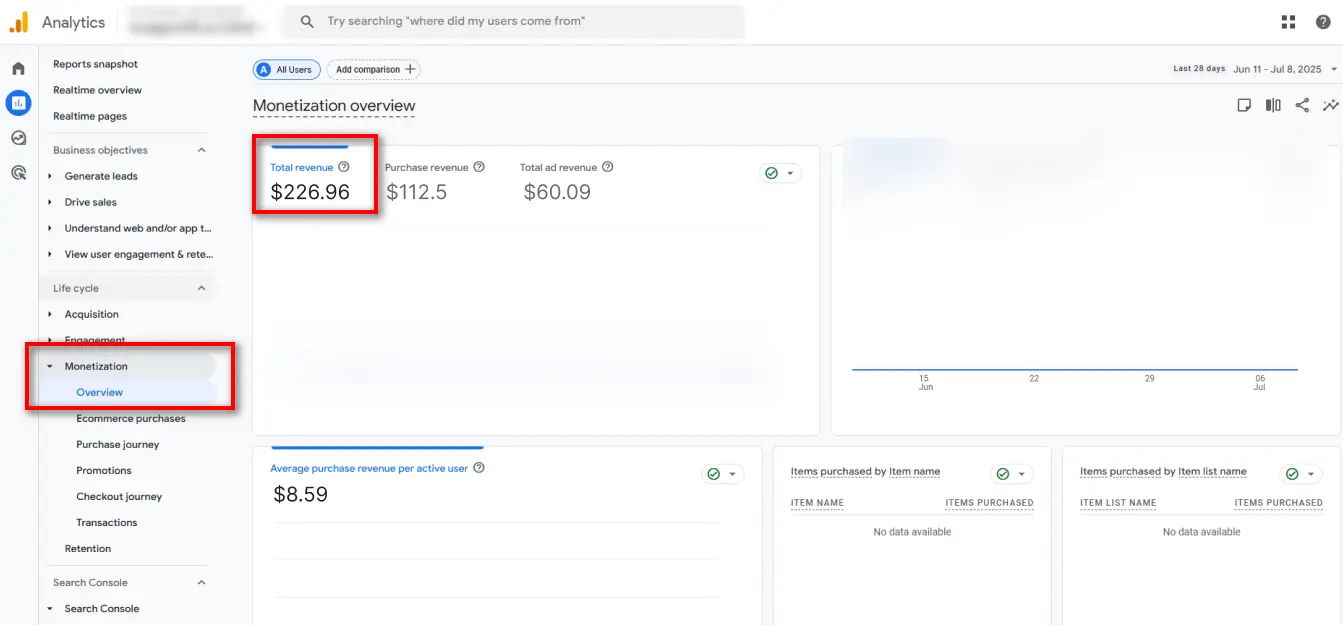
It sounds simple, but getting this to work takes setup. You’ll need to tell Google Analytics what counts as a sale by setting up conversion tracking, sending in your cost data, and adding values to each sale. If you’ve done this, Google Analytics will display your revenue automatically. If not, you won’t see your true numbers here.
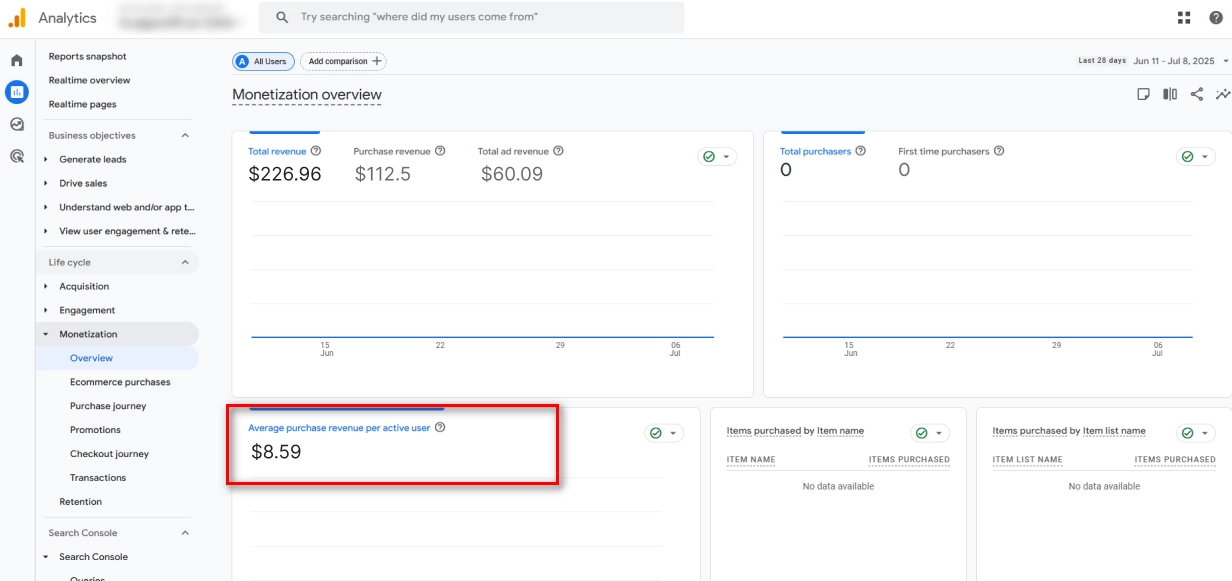
2. Average Order Value
In Google Analytics, Average Order Value is tracked as “average purchase revenue.” You’ll find it under Reports > Monetization > Overview, but if you want to see AOV by channel, device, or campaign, you’ll need to build a custom Exploration report.
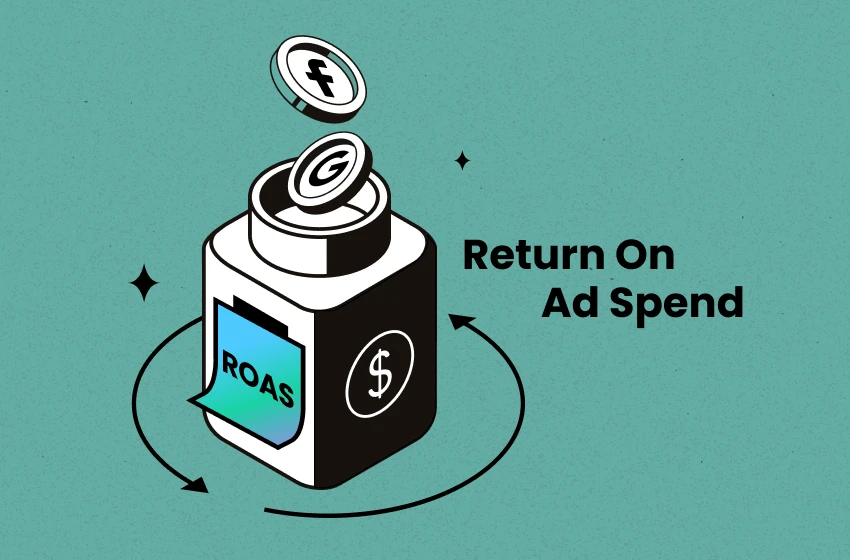
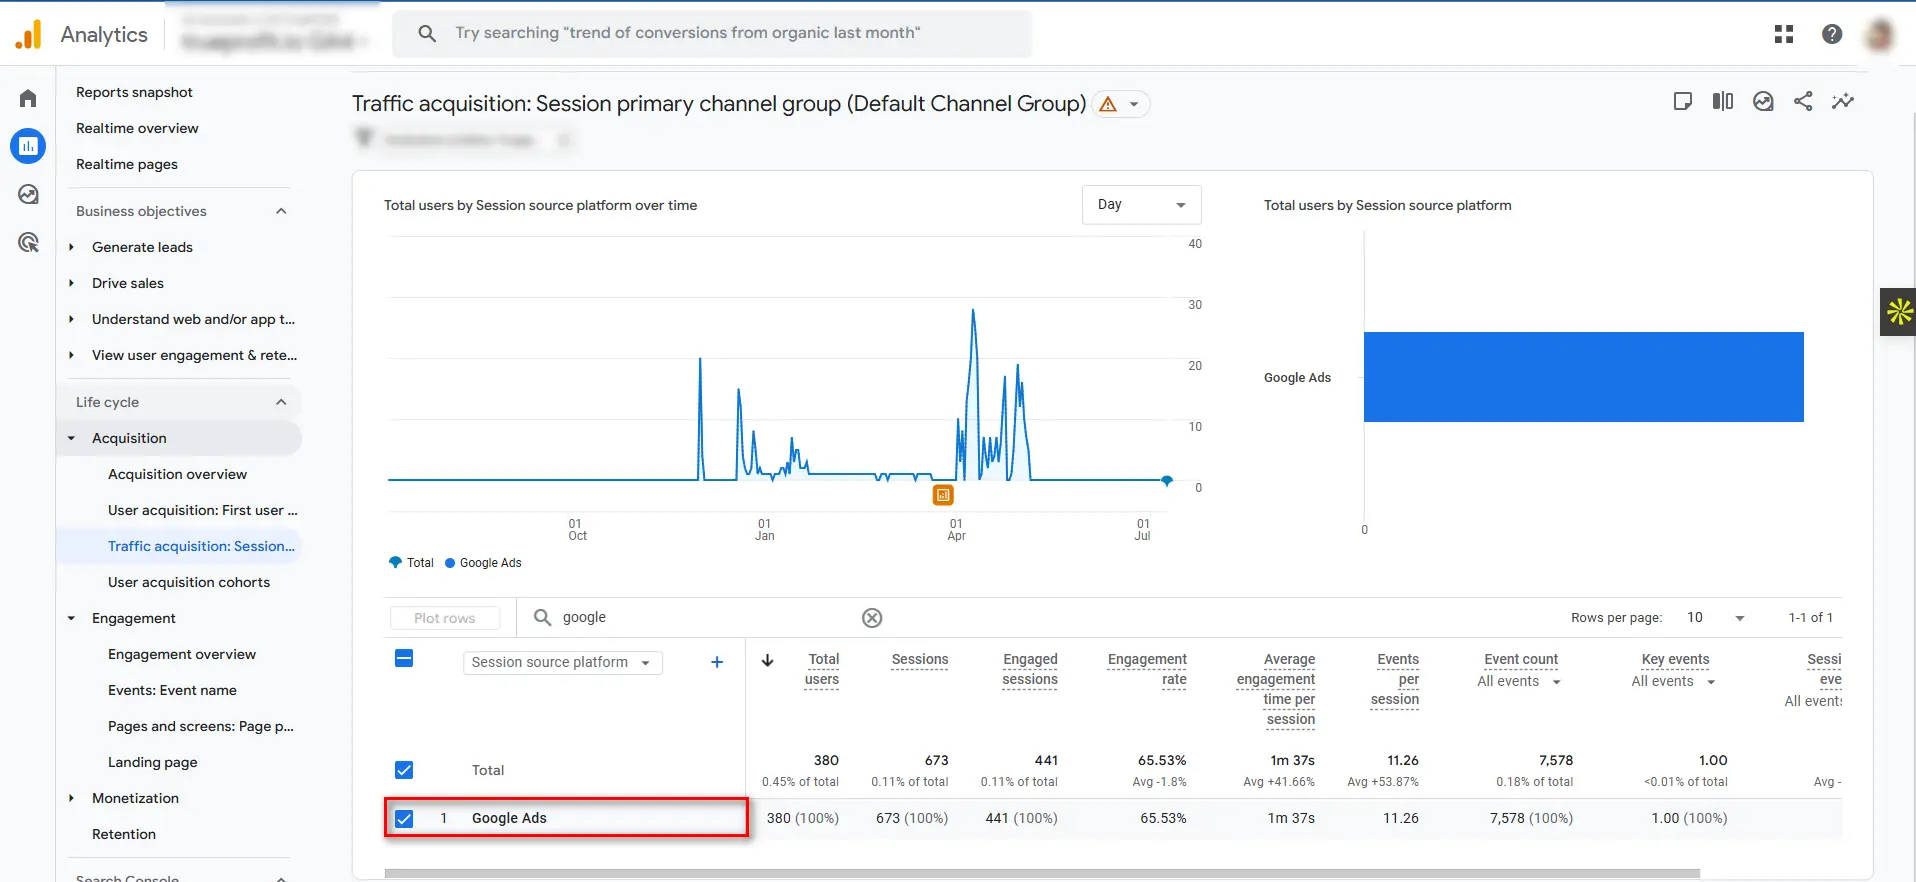
3. Advertising cost
In Google Analytics, this isn’t explicitly called “revenue on ad spend.” Instead, Google Analytics breaks it down into ad cost versus revenue. To calculate it, you’ll need to divide purchase revenue by ad spend to get your ROAS manually.
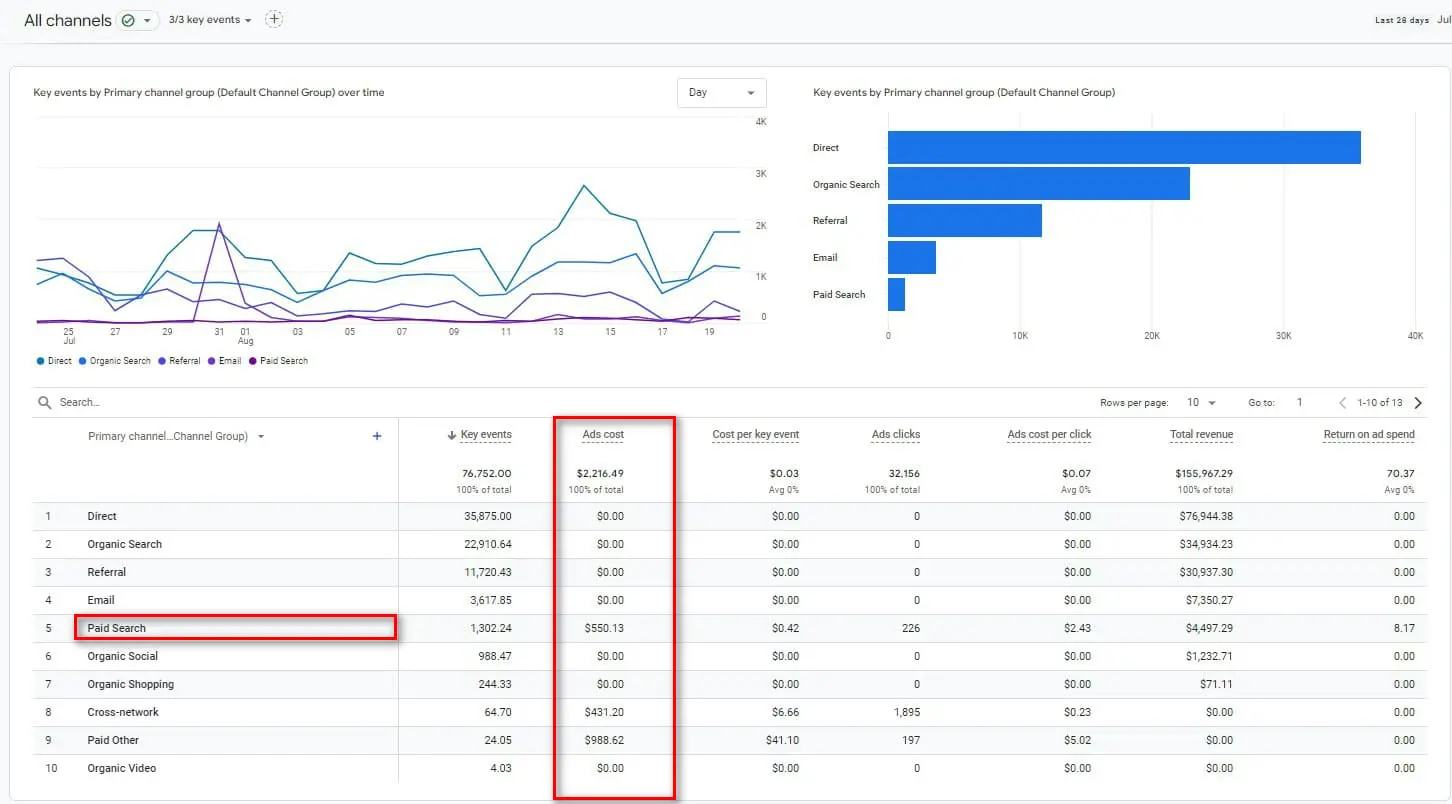
Keep in mind, ad cost in Google Analytics by default only covers Google Ads campaigns. While you can track traffic sources and conversions from other ad platforms (Meta, TikTok, Pinterest), you’ll need proper UTM tagging, and those visitors must convert for the data to appear.
4. Lifetime Value
Google Analytics shows Lifetime Value (also known as Customer Lifetime Value) up to 90 days.
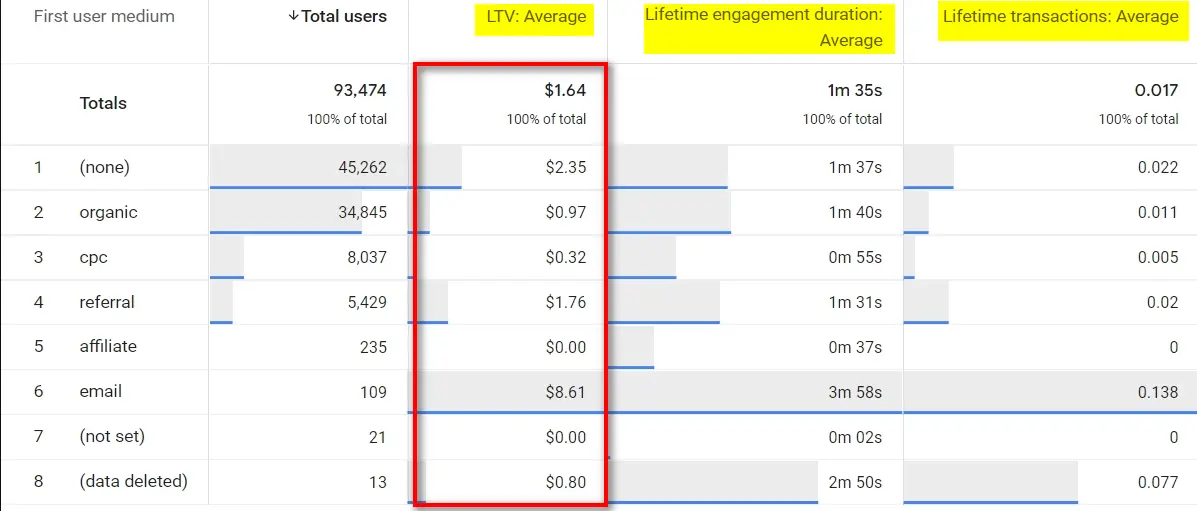
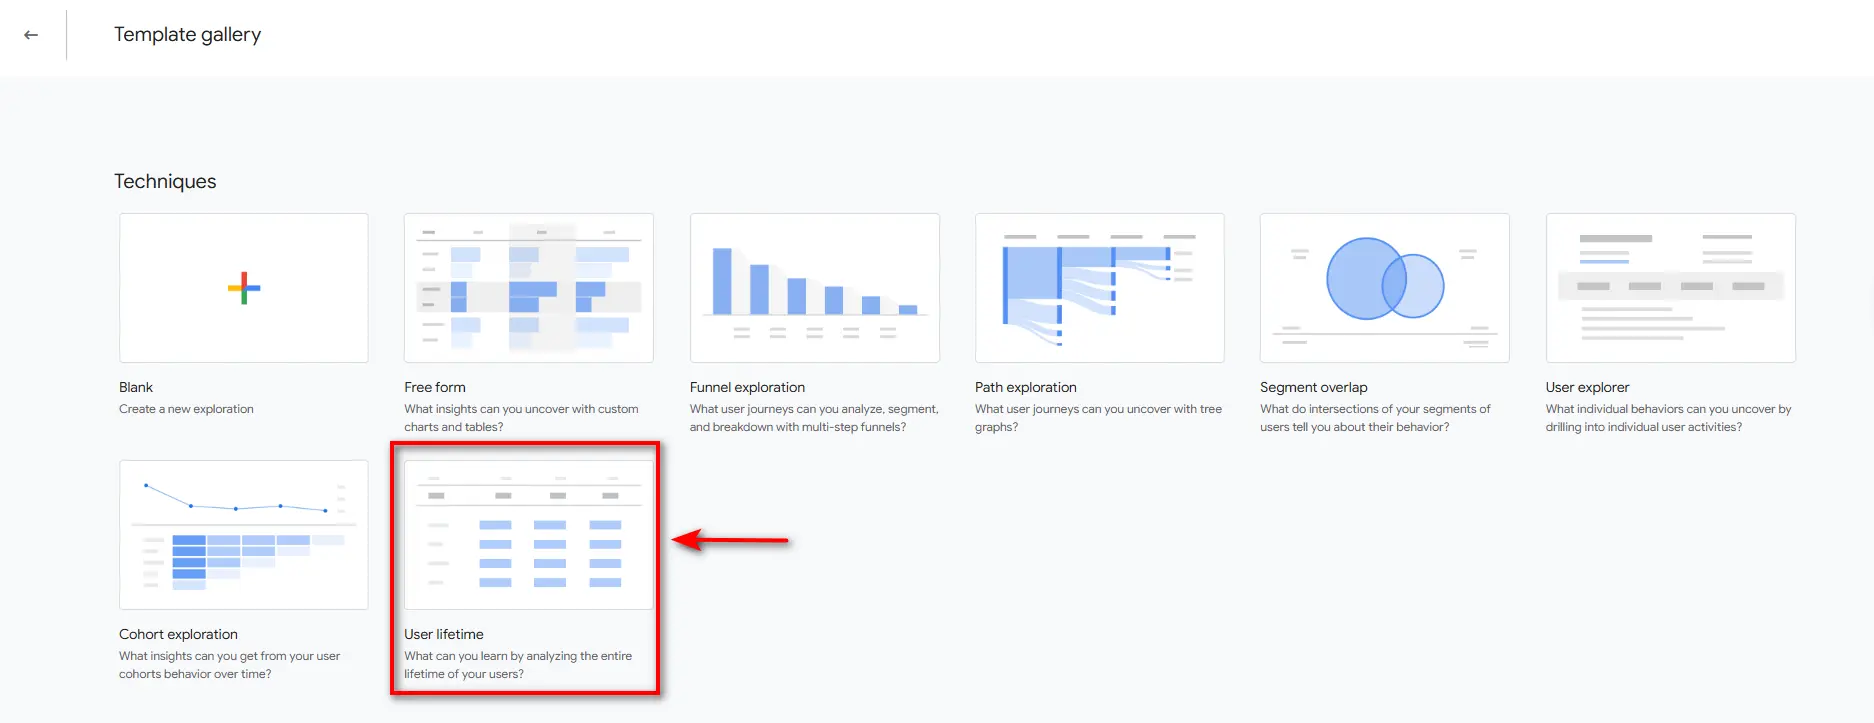
You can find this by going to the Explore tab and opening the “User lifetime” report.
How to Use Google Analytics for Ecommerce
Here’s how to turn GA data into insights that you can act on.
1. Find Your Most Profitable Customers
It gets better:
You can use Google Analytics to find the customers who actually spend money in your store. Sort your data by location, device, or channel to see who buys the most and comes back for more.
Once you know who your best customers are, you can target more people like them.
2. Build High-Intent Audiences for Ads
Here’s a strategy that’s working GREAT right now:
Connect Google Analytics to your Google Ads account. Then, build custom audiences based on high-value actions like “Add to Cart” or “Viewed Product X.”
You can retarget these warm shoppers with ads, bringing them back to finish their purchase.
3. Map Your Customer Journey
Most store owners only look at top-line traffic. Big mistake.
With Google Analytics, you can see how visitors move from landing pages to product pages to checkout. You’ll spot where customers drop off, so you can fix leaks and boost conversions.
4. Measure Your Marketing ROI
Paid ads, emails, social posts—are they working?
Google Analytics shows which channels drive sales, not just clicks. Check the “Conversions” report to see what’s really moving the needle, so you stop wasting money on channels that don’t convert.
5. Create Custom Reports for Smarter Decisions
Use GA4’s “Explore” tool to build custom reports that track what matters to your business—like repeat purchase rate, checkout abandonment, or channel-specific revenue.
These explorations help you go beyond surface-level data and make decisions that drive revenue, not just traffic.
TrueProfit - The Best Profit Tracker Beyond Google Analytics
Here's the hard truth: While GA4 excels at showing you website traffic and conversions, it leaves you completely blind to what actually matters for your business—real profitability.
You might think you're profitable based on GA4's revenue reports, only to discover you're actually losing money once you factor in ad spend, shipping costs, and fees.
That's where TrueProfit changes everything.
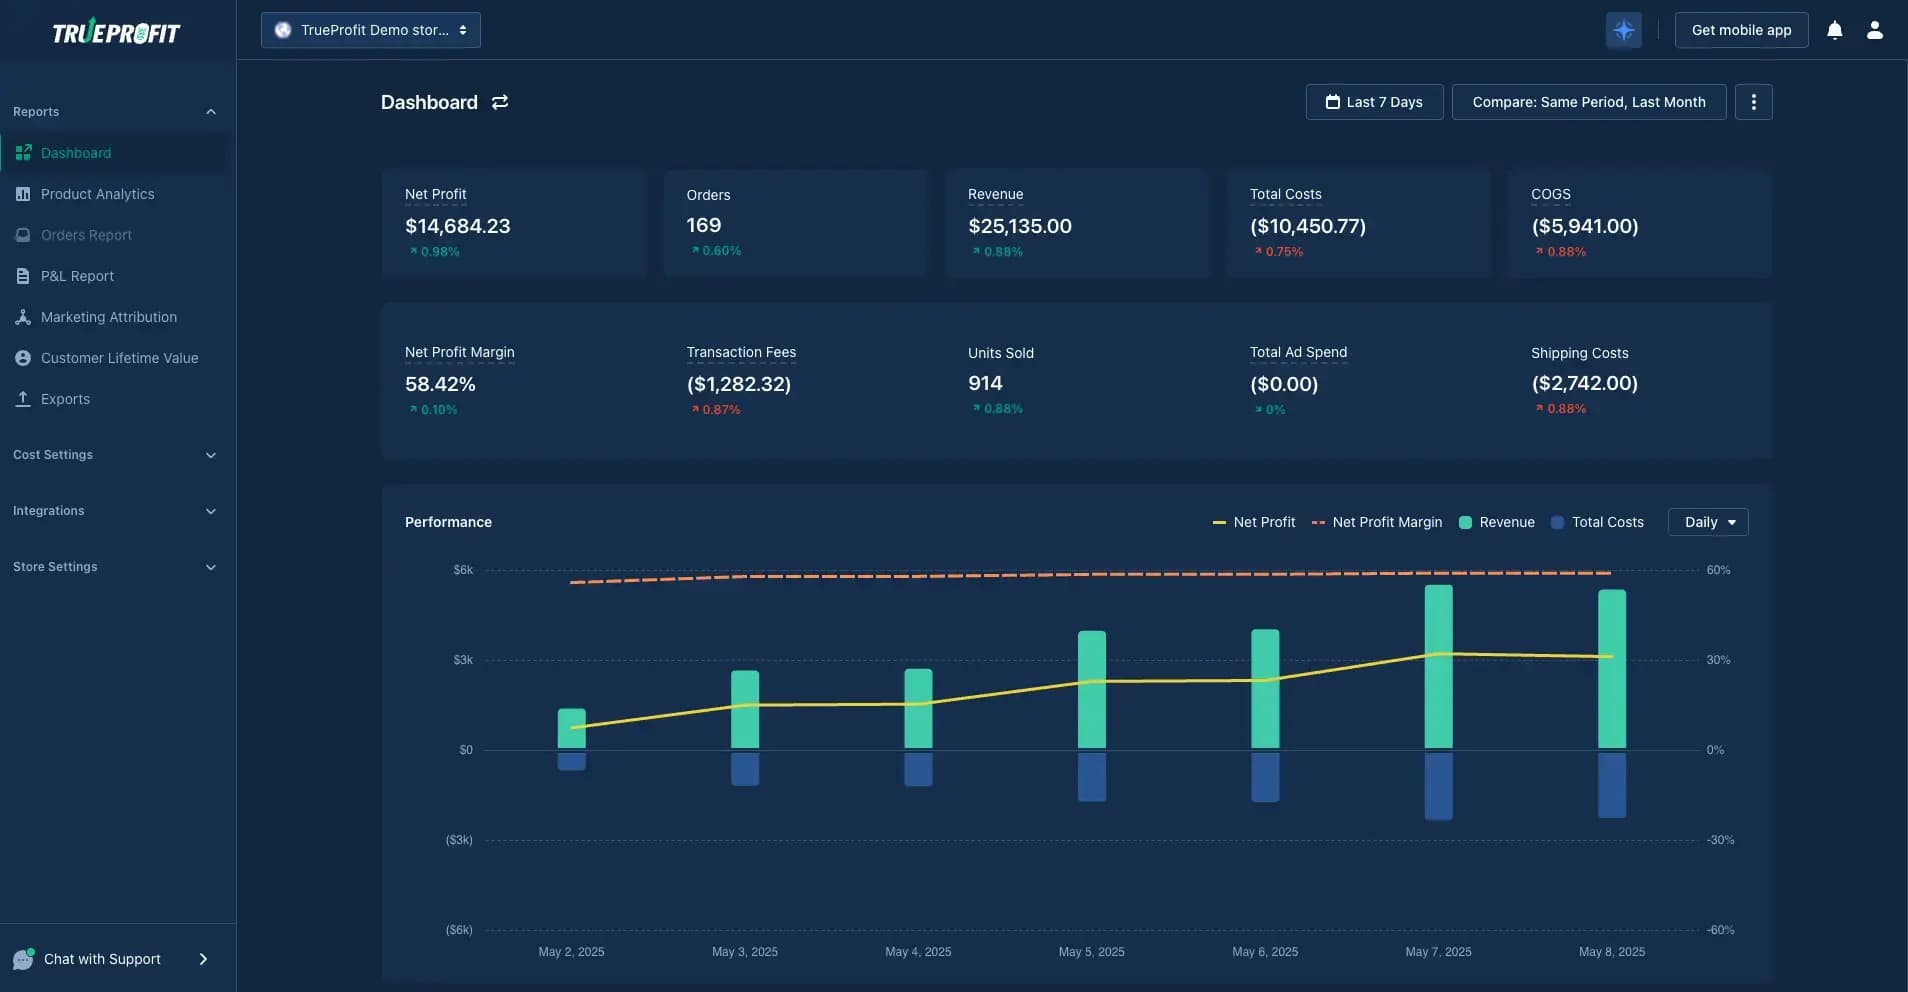
TrueProfit is a real-time profit analytics tool built specifically for Shopify sellers who need to see beyond surface-level metrics.
It automatically tracks product-level COGS, multi-channel ad spend, shipping fees, transaction fees, and custom costs—giving you true profit and loss data without hours of manual spreadsheet work.
Here's what you're missing with GA4 vs. what TrueProfit delivers:
What You Need to Know | Google Analytics (GA4) | TrueProfit | Business Impact |
|---|---|---|---|
Actual Net Profit | ❌ Not Available | ✅ Real-time tracking | Know if you're truly profitable |
True ROAS (All Channels) | ❌ Not Available | ✅ Unified view | Stop wasting ad budget |
Customer Acquisition Cost | ❌ Not Available | ✅ Precise calculation | Price products profitably |
LTV:CAC Ratio | ❌ Not Available | ✅ Automated tracking | Make smarter growth decisions |
Profit per Order | ❌ Not Available | ✅ Order-level insights | Identify your best customers |
Why 60,000+ Shopify sellers trust TrueProfit (4.9/5 stars, #1 profit tracking app):
- Tracks every cost automatically—from COGS, Facebook ads to PayPal fees to shipping costs across all channels
- Updates profit in real-time—see your net margins change as orders come in, not days later
- Integrates with everything—syncs with your fulfillment platforms, ad accounts, and payment gateways instantly
The bottom line: GA4 shows you vanity metrics. TrueProfit shows you money metrics.
Ready to see your real profits? Start your free 15-day trial of TrueProfit—no credit card required, full setup support included.
Google Analytics for Ecommerce Website FAQs

Lila Le is the Marketing Manager at TrueProfit, with a deep understanding of the Shopify ecosystem and a proven track record in dropshipping. She combines hands-on selling experience with marketing expertise to help Shopify merchants scale smarter—through clear positioning, profit-first strategies, and high-converting campaigns.