What Is Ecommerce Analytics? A Complete Guide in 2026

Table of Contents
Think of ecommerce analytics as your store’s health check: It’s the process of collecting and analyzing ecommerce metrics across your ecom store, so you understand your metrics and optimize your store without guesswork.
And it’s not optional if you want to grow profitably. Gartner predicts 65% of businesses will rely on data-driven decisions by 2026. If you want your store to be one of them, keep reading.
We’ll break down exactly what ecommerce analytics means, which metrics to track, and how you can use these insights to run a healthier, more profitable ecom store.
In this blog:
What is Ecommerce Analytics?
Ecommerce analytics is the process of collecting and reviewing data from your online store. For ecom sellers, this means tracking the behavior of your visitors, the performance of your products, how much you’re spending to get a customer, and how much each customer is really worth to your business.
What it does:
Here are a few things ecommerce analytics helps you answer:
- Where are my customers coming from? -> Double down on the channels that bring you traffic.
- Which products drive the most revenue? -> Save your storefront space for top-performing products.
- How much does it really cost to get a sale? -> See if your ad spend and product costs leave you with enough profit.
- Are my marketing efforts profitable? -> Make sure every investment has a high return.

The Core Benefits of Ecommerce Analytics
3 key benefits once you start using ecommerce analytics:
Track Multi-Channel Ad Performance
Tracking multi-channel ad performance helps you understand one thing:
How your ad channels work together to drive a sale.
So, why not try exporting CSVs from each ad platform report and stitching them together in a spreadsheet?
Because this method is never fully accurate.
Ad platforms are built to self-credit, not credit each other. Facebook reports Facebook. TikTok reports TikTok. Each relies on its own silo, often competing to claim the same sale.
That’s where ecommerce analytics comes in.
- Acts as your unbiased source of truth, pulling in data from all your ad platforms
- Tracks customer actions across channels—from first click to final purchase.
- Runs advanced attribution models—rules that define and calculate touchpoints across a customer’s journey—so you can credit the exact role to each channel, campaigns, even ad set.
Most ecommerce analytics has its own attribution models—like first-click attribution, last-click attribution, linear attribution, and time-decay attribution. Depending on what type you use, you’ll get different lenses on ad performance and confidently invest your spending where your ad works best.
Analyze Metrics Over Time
Daily metrics won’t tell much about your store's true health, being honest, we recommend you shouldn’t make decisions off short-term spikes or drops.
True ecom insight comes from tracking metrics over time and comparing them month-over-month or year-over-year.
That’s where ecommerce analytics come in. It helps you spot patterns:
- You see seasonality, like why ROAS (Revenue on ad spend) dips every Q1.
- You catch rising CAC (Customer Acquisition Cost) before it eats your margins.
- You benchmark new campaigns against proven winners.
- You predict inventory needs before the next spike leaves you out of stock.
3. Make Data-Driven Decisions
Ecommerce analytics helps you tie every decision to the right metric—so you can measure its impact on your business using that metric as your KPI.
Take TrueProfit - A Shopify net profit analytics tool for example. If you try to cut ad spend, TrueProfit dashboard lets you check typical metrics like total ad spend, ad spend by channel, ROAS (revenue on ad spend).
Then it tracks beyond —net profit you generate on every dollar of ad spend (net profit on ad spend) and its impact on your bottom line (net profit).
These metrics reveal your true ad efficiency, helping you see whether cutting spend protects your margins or just slows your growth.
3 Main Types of eCommerce Analytics
There are 3 main types of ecommerce analytics:
- Descriptive Analytics: Descriptive analytics tells you what’s going on right now in your store. It helps you understand customer behavior and spot trends. You’ll see which products sell, which pages people visit, and what your sales look like over time.
- Predictive Analytics: Predictive analytics uses your past data to forecast what might happen in the future. It helps you plan inventory, predict sales spikes, and estimate customer lifetime value.
- Prescriptive Analytics: Prescriptive analytics goes a step further by telling you what actions to take based on your data.
5 Use Cases of Ecommerce Analytics
Use Case 1: Tracking On-site Engagement
On-site engagement analytics collects, tracks, and analyzes data related to how visitors interact with your storefront — every scroll, click, and bounce.
Key metrics to watch:
Metric | Definition | Formula |
|---|---|---|
Time on site | Average time a visitor spends per session | Total time on site / Total sessions |
Pages per visit | Number of pages a visitor views in one visit | Total pageviews / Total sessions |
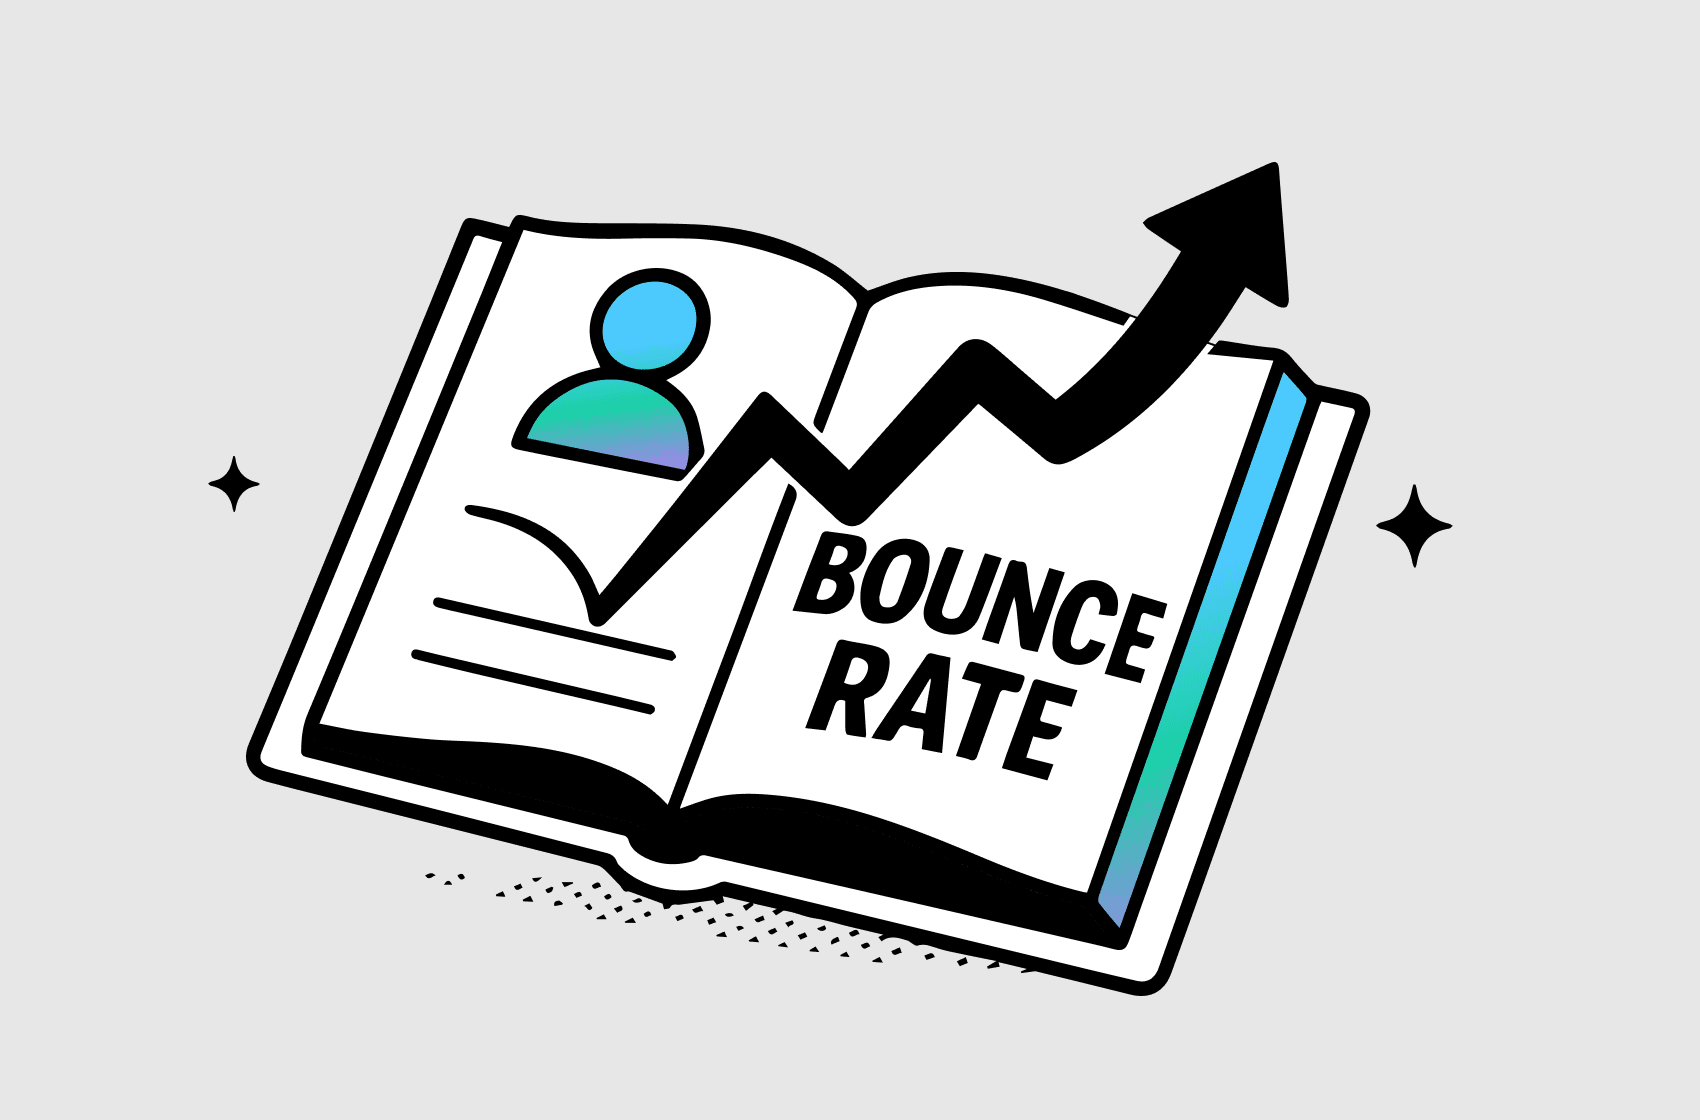
Bounce rate | % of visitors who leave after one page | (Single-page visits / Total visits) × 100 |
Returning visitors | % of visitors who come back | (Returning visitors / Total visitors) × 100 |
Use Case 2. Analyzing Customer Lifetime Value (LTV)
Customer profitability analysis is the process of tracking and analyzing customer spending patterns over time to estimate the long-term value of each customer.
Key metrics to watch:
Metric | Definition | Formula |
|---|---|---|
Lifetime Value | Revenue a customer brings in over their lifecycle | Avg. order value × purchase frequency × profit margin |
Customer Acquisition Cost (CAC) | How much it costs to acquire a customer | Total ad spend ÷ new customers acquired |
LTV:CAC Ratio | The return on acquisition spend | CLV ÷ CAC |
A healthy LTV/CAC ratio (typically 3:1 or higher) means you’re gaining more value from a customer than it costs to acquire them — a key signal of scalable, sustainable growth.
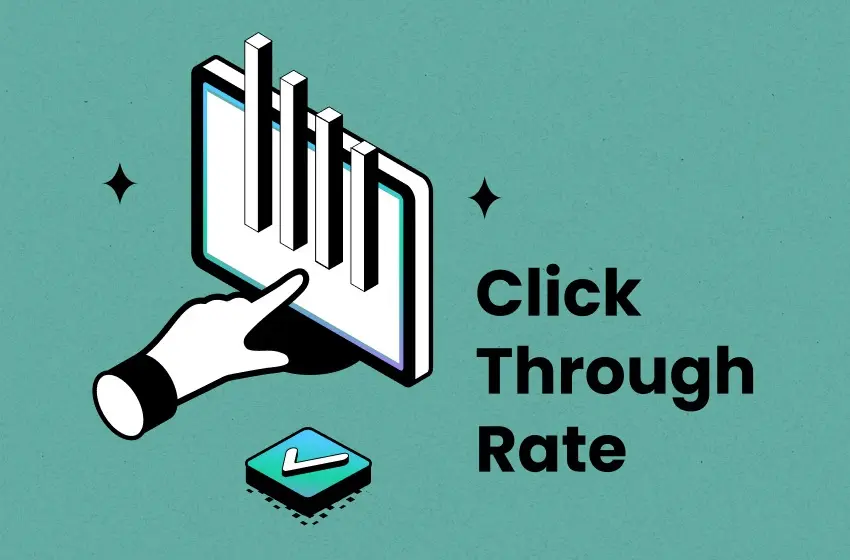
Use Case 3. Optimizing Acquisition & Conversion
Conversion analytics help you understand how visitors find your store and what they do once they land — literally collect and track all metrics along the full journey: from ad click to checkout.
Key metrics to watch:
Metric | Definition | Formula |
|---|---|---|
Conversion Rate | % of visitors who complete a purchase | (Orders ÷ Total visitors) × 100 |
Cost Per Click (CPC) | Average cost for each ad click | Total ad spend ÷ Total clicks |
Add-to-Cart Rate | % of visitors who add items to cart | (Add-to-carts ÷ Visitors) × 100 |
Checkout Initiation Rate | % of sessions where checkout starts | (Checkout starts ÷ Sessions) × 100 |
Abandonment Rate | % of carts or checkouts not completed | 1 − (Completed purchases ÷ Initiated checkouts) |
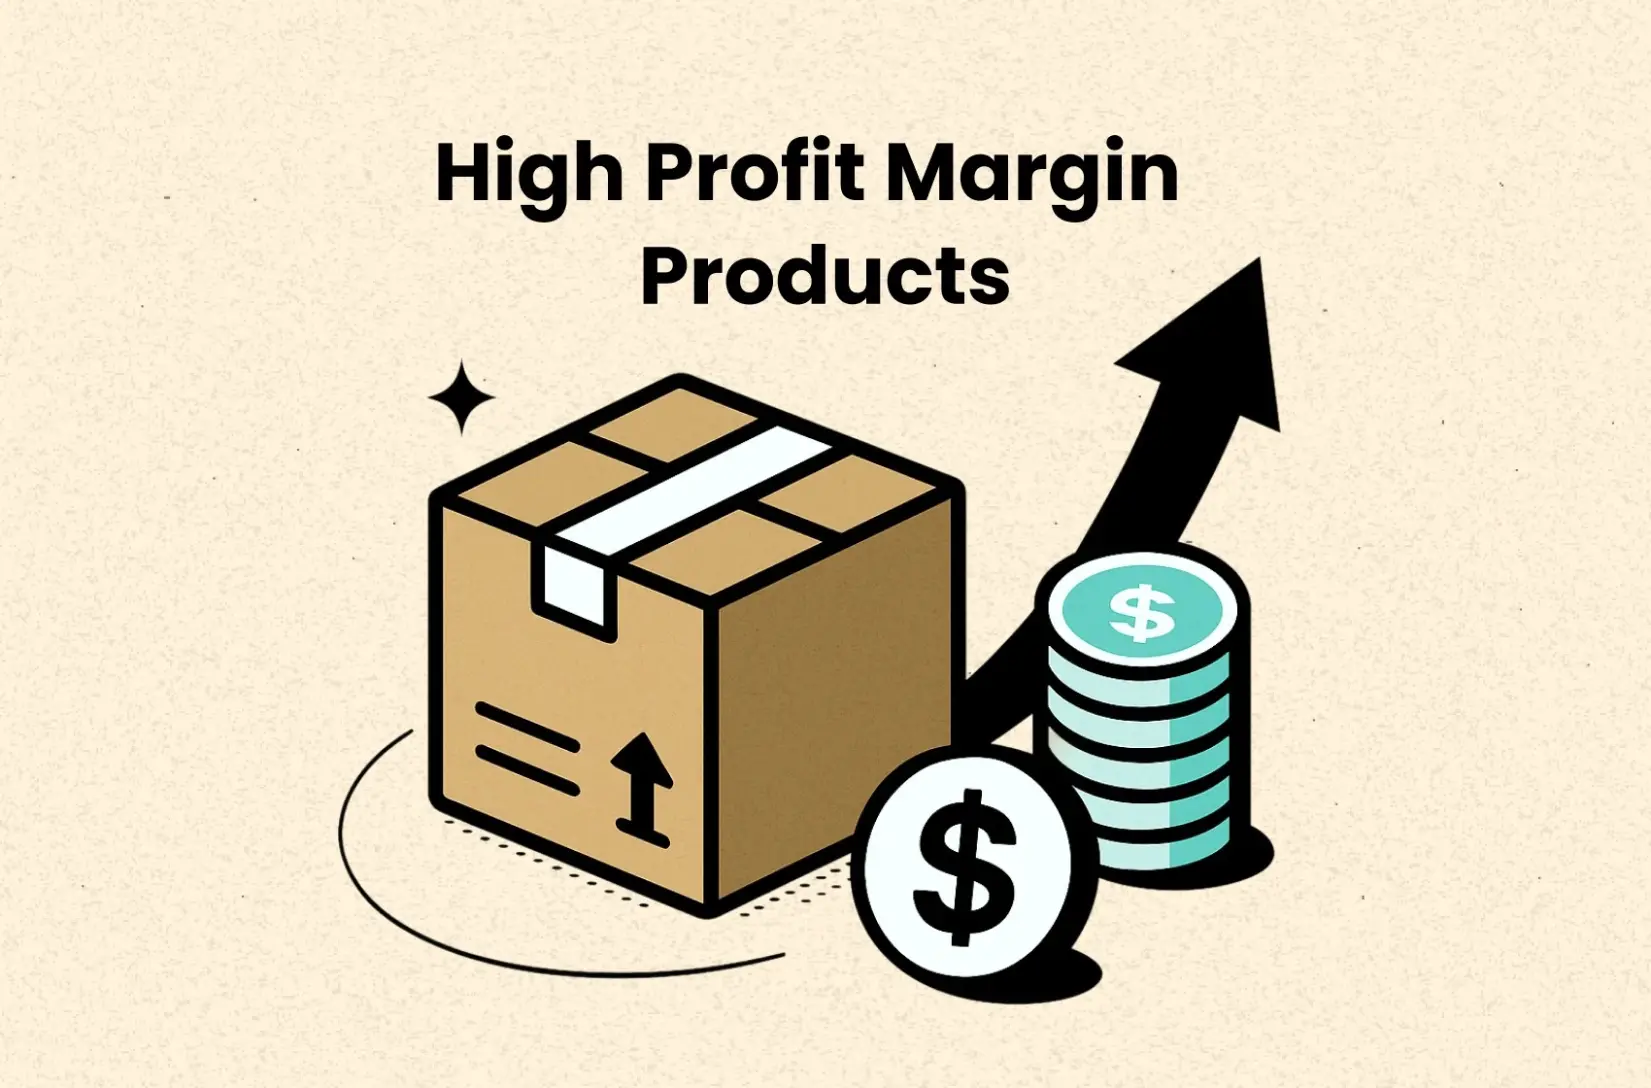
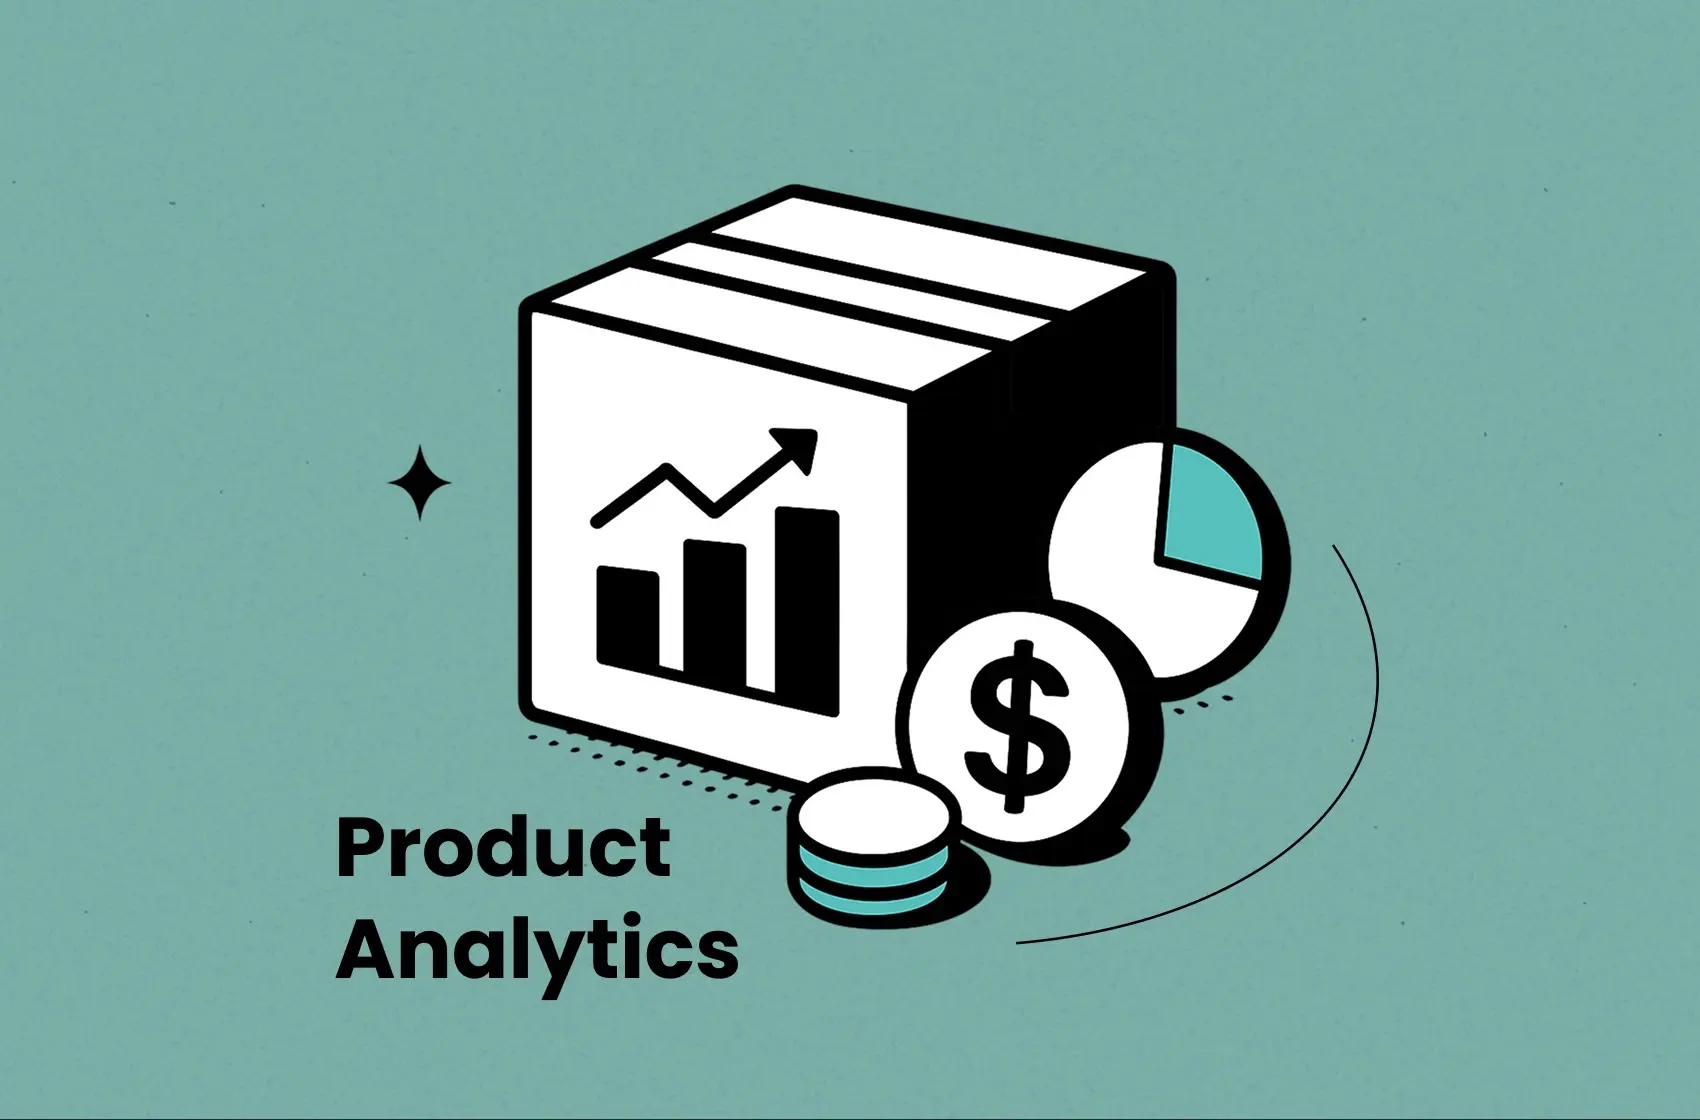
Use Case 4. Tracking Product Performance
Product performance analytics is the process of tracking how each product contributes to your store’s revenue, profit, and overall customer behavior. It tells you what’s selling, what’s sitting, and what’s silently draining your margins.
Key metrics to watch:
Metric | Definition |
|
|---|---|---|
Add-to-Cart Rate | % of views that turn into add-to-cart actions | (Add-to-cart actions ÷ Product views) x 100 |
Purchase Conversion Rate | % of product views that lead to a sale | (Units sold ÷ Product views) x 100 |
Revenue per Product | Total revenue from each item | Units sold x Selling price |
Gross Profit per Product | Revenue after subtracting COGS | Revenue − COGS |
% of units returned per product | (Units returned ÷ Units sold) x 100 |
Use Case 5. Analyzing Profit Performance
Profit analytics dives into your store’s finances to reveal net profit. It pulls in data from selling platforms, ad platforms, shipping, and COGS to uncover your store’s true financial health.
Key metrics to watch:
Metric | Definition | Formula |
|---|---|---|
Net Profit | Profit after all costs | Revenue − All types of costs |
Your business's profitability when comparing net profit to sales revenue. | (Net Profit / Revenue) * 100 | |
Revenue | The total amount of money generated from sales | Gross Sales – Discounts – Returns + Taxes Collected + Shipping Charged |
Gross Profit | The profit you make after subtracting the costs of producing and distributing your products. | Revenue + Tips + Gift Card Sales - COGS - Shipping Cost - Transaction Fees - Handling Fees |
Your business's profitability when comparing gross profit to sales revenue. | Gross Profit Margin = (Gross Profit / Revenue) * 100 | |
The direct cost of manufacturing your products | x | |
ROAS (Return on Ad Spend) | It measures the amount of revenue your business earns for each dollar spent on advertising platforms. | Revenue / Ad Spend |
NOAS (Net Profit on Ad Spend) | It measures the amount of profit your business earns for each dollar spent on advertising platforms. | Net Profit / Ad Spend |
LTV/CAC ratio | This ratio shows the Lifetime Value of a customer as compared to the cost of acquiring them. | LTV = Total Revenue / Total CustomersCAC = Total Ad spend + Total Custom Costs with LTV:CAC / New Customers (Number of first customers) |

Simplify Your Ecommerce Analytics Through Automation
Tired of juggling through spreadsheets, Google Analytics, ad dashboards and other ecom reports just to check if you’re truly profitable?
TrueProfit is the best Shopify profit tracker app that brings your net profit into one real-time dashboard. Instead of tracking revenue, sales, and surface-level metrics, TrueProfit goes the extra mile to show your true profit after all ad spend, COGS, shipping fees, and more to reveal your bottom line anytime, anywhere.
TrueProfit can help you with:
- Real-Time Net Profit Tracking: Get a real time view of true profit after all costs.
- Product-Level Profit Analytics: Spot your most profitable products, not just your bestsellers.
- Automated LTV & CAC Tracking: Understand customer value and acquisition costs without manual calculations.
- Accurate Marketing Attribution: See which channels bring profitable customers, so you can invest confidently.
- Live P&L Without Spreadsheets: Get a clear, real-time view of your store’s profit and loss to make faster decisions.
- Mobile App Access: Track profit on the go with TrueProfit’s mobile app for iOS and Android
👉 Ready to track your true profit?
Try TrueProfit Now. Your first 14 days trial is free.

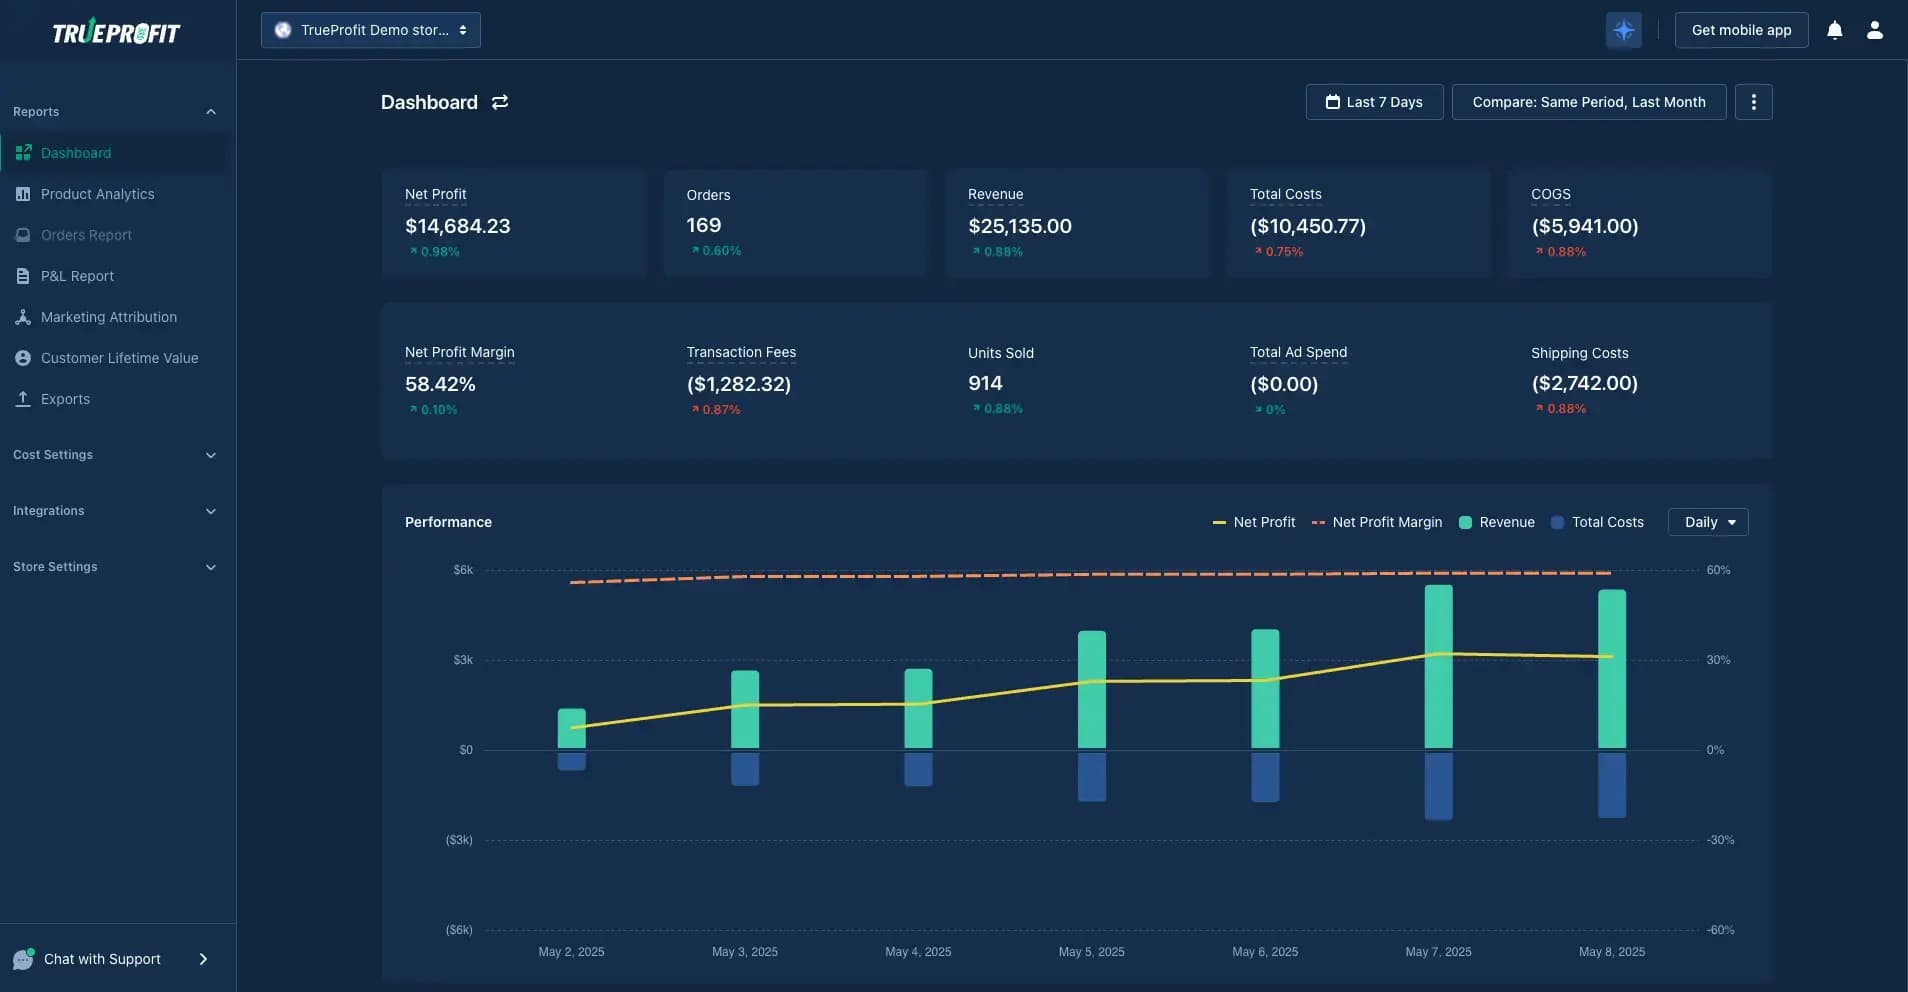
TrueProfit's dashboard
eCommerce Analytics FAQs

Leah Tran is a Content Specialist at TrueProfit, where she crafts SEO-driven and data-backed content to help eCommerce merchants understand their true profitability. With a strong background in content writing, research, and editorial content, she focuses on making complex financial and business concepts clear, engaging, and actionable for Shopify merchants.