7 Shopify Reports Every Beginner Should Use in 2026

Table of Contents
Shopify reports are your store's built-in performance tracker that shows sales, profit, customer behavior, and product analytics all in one place.
In this guide, you'll discover the 7 most critical Shopify reports to run a successful ecommerce business in 2026.
We'll break down each report type with specific metrics to track. Plus, we'll show you when standard Shopify reporting isn't enough and what advanced tools can fill the gaps.
Let’s dive in.
In this blog:
What is Shopify Report?
Shopify reports show your store performance through metrics. They track your sales, profit, customer behavior, and product analytics in one place.

Why Shopify Report Matters?
Shopify reports matter because they help you move from “making sales” to “building a profitable, sustainable business.
Think of it as the X-ray of your store. They can help you in some use cases. For example:
Shopify reports matter because they help you move from “making sales” to “building a profitable, sustainable business.
Think of it as the X-ray of your store. They can help you in some use cases. For example:
- Check your behavior reports to spot where shoppers drop off.
- Your order and profit reports can reveal if returns or high shipping costs are quietly draining your margins.
- Marketing reports will show you which channels drive not just sales, but high-profit customers.
With them, you’re making decisions backed by hard data, so you can scale profitably without guesswork.
7 Main Types of Shopify Reports
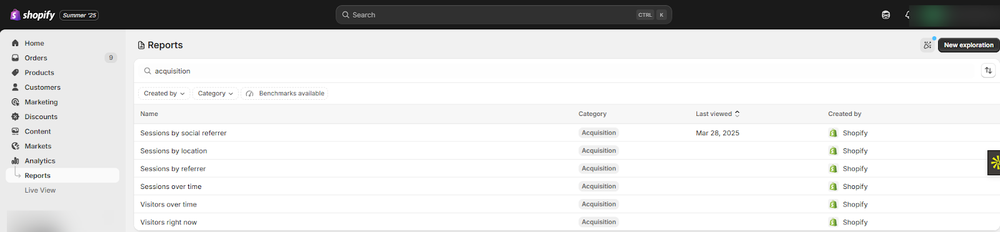
1. Acquisition Reports
Acquisition reports give you a clear view of your traffic sources.
A quick heads-up: Shopify uses cookies to track visits, so a single visitor can generate multiple sessions if they return. Sessions end after 30 minutes of inactivity or at midnight UTC.
If your report looks outdated, just refresh, it sometimes takes a few minutes to pull in the latest data.
Acquisition Report Types to Run:

Key Metrics:
Key Metrics | What It Tracks |
|---|---|
Sessions by social referrer | Tracks sessions from each social platform to see which channels drive traffic. |
Sessions by location | Tracks where users are located to identify top regions driving traffic. |
Sessions by referrer | Tracks which websites or sources send traffic to the store. |
Sessions over time | Tracks total sessions over time to show traffic trends. |
Visitors over time | Tracks unique visitors over time to gauge audience growth. |
Visitors right now | Tracks the number of users currently active on the store in real-time. |
2. Behavior Reports
Behavior reports show you how people interact with your site so you can:
- Build better product bundles
- Spot upsell opportunities
- Improve your store’s layout for more sales
Behavior Reports let you see exactly what shoppers do there and start making changes that actually move your sales needle.
Behavior Report Types to Run:
Key Metrics:
Key Metrics | What It Tracks |
|---|---|
Conversion rate breakdown | Likely breaks down conversion rates by various factors. |
Bounce rate over time | How the bounce rate (single-page sessions %) changes over time. |
Checkout conversion rate over time | How checkout conversion rates change over time. |
Conversion rate over time | How overall visitor-to-customer conversion rates change over time. |
Customer behavior | General insights into customer actions and interactions. |
Product recommendation conversions over time | How product recommendations lead to conversions over time. |
Product recommendations with low engagement | Product recommendations with low customer interaction. |
Search conversions over time | How store searches lead to conversions over time. |
Searches by search query | The specific search terms customers use on the store. |
Searches with no clicks | Search queries that get no clicks on results. |
Searches with no results | Search queries that yield no results on the store. |
Sessions by device type | Sessions broken down by device type (mobile, desktop, tablet). |
Sessions by landing page | Sessions originating from different landing pages. |
Shop Campaign ROAS | Return on Ad Spend (ROAS) for Shop campaigns. |
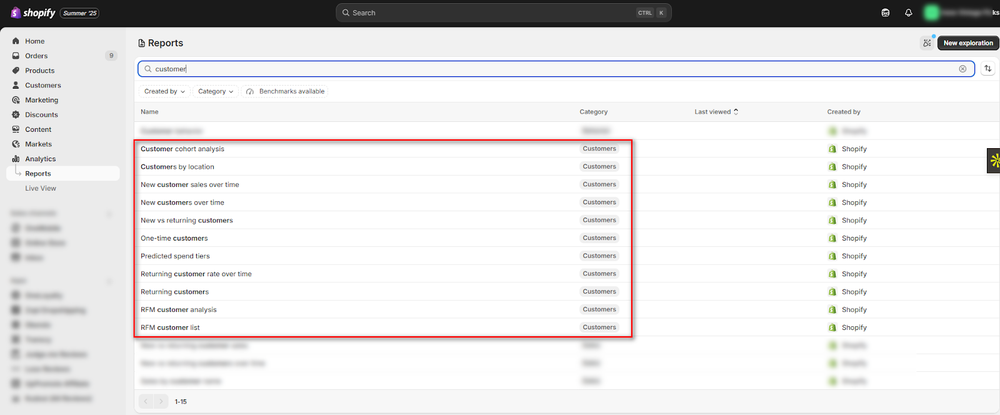
3. Customer Reports
Customer reports give you the full picture of who’s buying from you—and how often they come back.
They show you things like average order count, total spend, and customer lifetime value, helping you understand who your best customers are and how to segment your audience for future campaigns.
Customer Report Types to Run:
Key Metrics:
Key Metrics | What It Tracks |
|---|---|
Customer cohort analysis | Tracks groups of customers by acquisition date to analyze retention and LTV. |
Customers by location | Tracks where customers are located for marketing and shipping insights. |
New customer sales over time | Tracks revenue from new customers over time to assess acquisition effectiveness. |
New customers over time | Tracks the number of new customers acquired over a period. |
New vs returning customers | Tracks the proportion and behavior of new vs. returning customers. |
One-time customers | Tracks customers who made only one purchase to identify upsell opportunities. |
Predicted spend tiers | Predicts and categorizes customers into future spending tiers. |
Tracks the percentage of repeat customers over time to evaluate loyalty. | |
Returning customers | Tracks customers who have made more than one purchase. |
RFM customer analysis | Segments customers by Recency, Frequency, and Monetary value for targeting. |
RFM customer list | Lists customers by RFM scores for targeted marketing campaigns. |
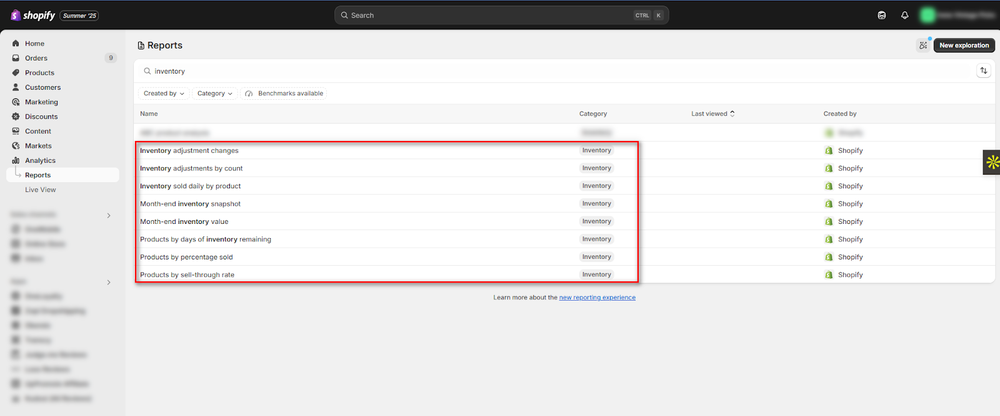
4. Inventory Reports
Running out of stock too soon or drowning in dead inventory?
Inventory reports help you avoid both. This report gives you a clear, month-end snapshot of what’s selling and what’s not, so you know exactly when (and what) to restock to keep cash flowing.
Inventory Report Types to Run:
Key Metrics:
Key Metrics | What It Tracks |
|---|---|
Inventory adjustment changes | Tracks all inventory level changes to monitor accuracy and discrepancies. |
Inventory adjustments by count | Tracks numerical adjustments to inventory quantities by product. |
Inventory sold daily by product | Tracks daily sales quantities for each product to gauge sales velocity. |
Month-end inventory snapshot | Provides a snapshot of inventory levels at each month’s end. |
Month-end inventory value | Tracks the total value of inventory at month’s end for financial reporting. |
Products by days of inventory remaining | Estimates days of stock left per product based on current sales. |
Products by percentage sold | Tracks the percentage of stock sold per product to identify demand patterns. |
Products by sell-through rate | Tracks the sell-through rate to assess inventory efficiency and sales performance. |
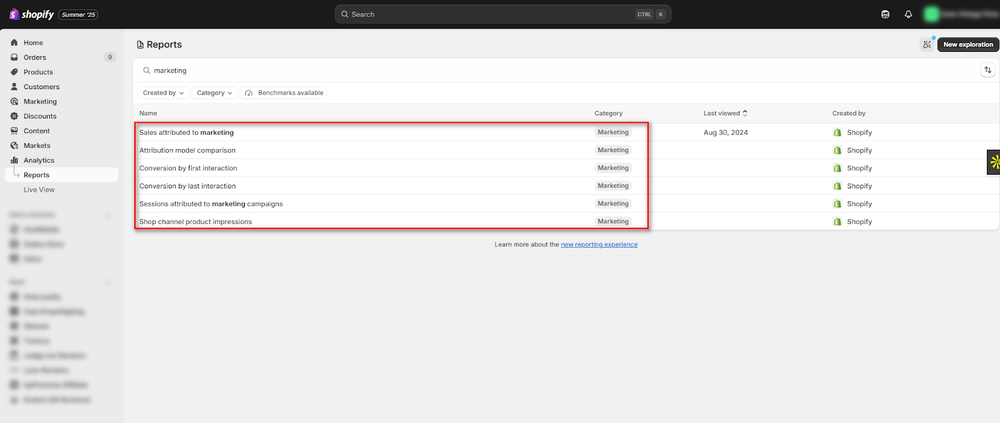
5. Marketing Reports
Are you trying to find your top-converting marketing channels?
See which campaigns drive the most traffic?
Your answers shape which marketing report you should check—and what insights will actually move your business forward.
Marketing Report Types to Run:
Key Metrics:
Key Metrics | What It Tracks |
|---|---|
Sales attributed to marketing | Tracks sales directly linked to marketing activities or campaigns. |
Attribution model comparison | Compares how different attribution models credit conversions across touchpoints. |
Conversion by first interaction | Tracks conversions based on the first marketing touchpoint before purchase. |
Conversion by last interaction | Tracks conversions based on the last marketing touchpoint before purchase. |
Sessions attributed to marketing campaigns | Tracks sessions originating from specific marketing campaigns. |
Shop channel product impressions | Tracks product views within the Shop channel to measure visibility. |
One quick note: Shopify’s marketing data can take up to 24 hours to update. If you’re measuring campaign results, wait a day before checking to get accurate data.
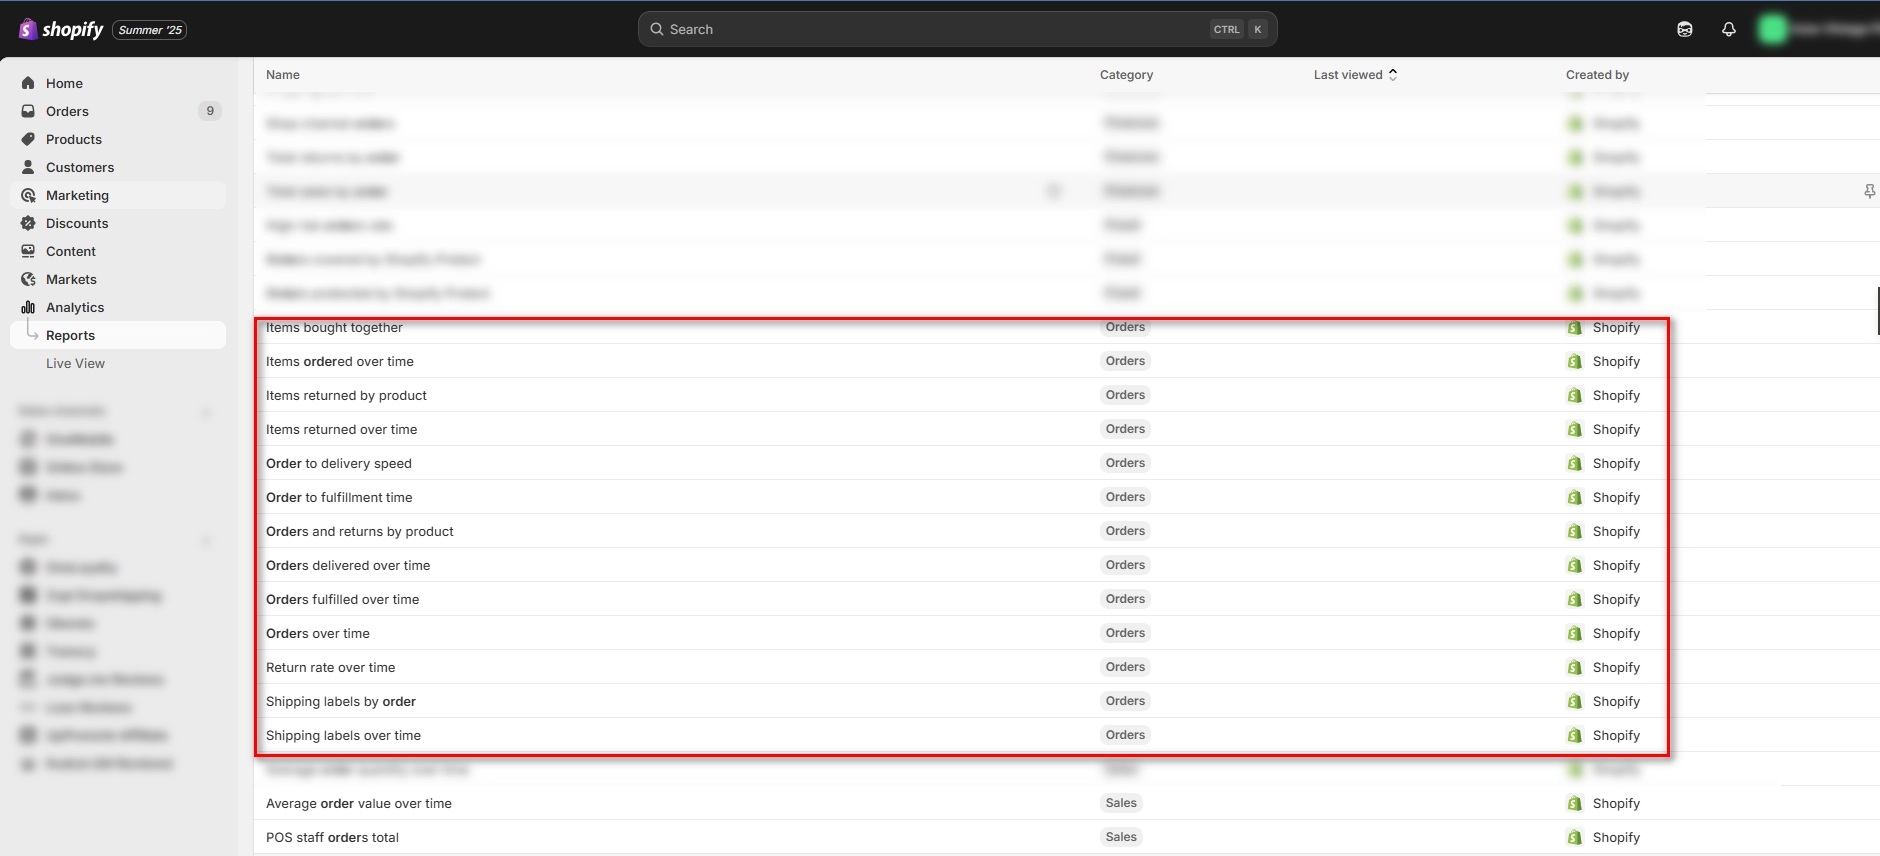
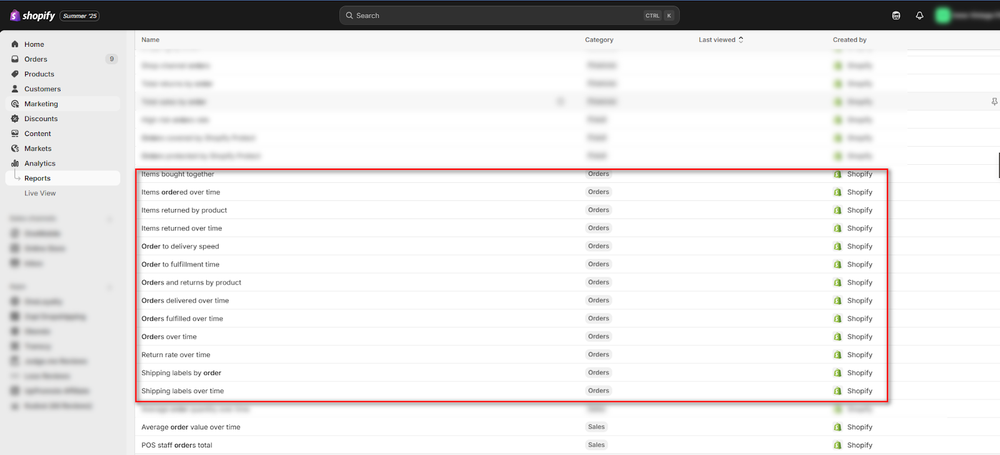
6. Order Reports
Want to understand what your customers love—and what keeps coming back as a return?
Start by checking your order reports.
They show you what’s selling, what’s getting returned, and how fast orders are moving from your warehouse to your customer’s doorstep.
Order Report Types to Run:
Key Metrics
Key Metrics | What It Tracks |
Items bought together | Tracks which products are frequently purchased together for cross-sell insights. |
Items ordered over time | Tracks quantities of items ordered over time to spot sales trends. |
Items returned by product | Tracks returns by product to identify high return rates and potential issues. |
Items returned over time | Tracks total returns over time to monitor return trends. |
Order to delivery speed | Tracks time from order placement to delivery to assess shipping speed. |
Order to fulfillment time | Tracks time from order placement to fulfillment to evaluate processing efficiency. |
Orders and returns by product | Tracks orders and returns per product for net sales performance insights. |
Orders delivered over time | Tracks number of orders delivered over time to monitor delivery completion. |
Orders fulfilled over time | Tracks number of orders fulfilled over time to monitor fulfillment efficiency. |
Orders over time | Tracks total orders received over time to understand sales volume trends. |
Return rate over time | Tracks return percentage over time to monitor satisfaction and financial impact. |
Shipping labels by order | Tracks shipping label usage and costs per order |
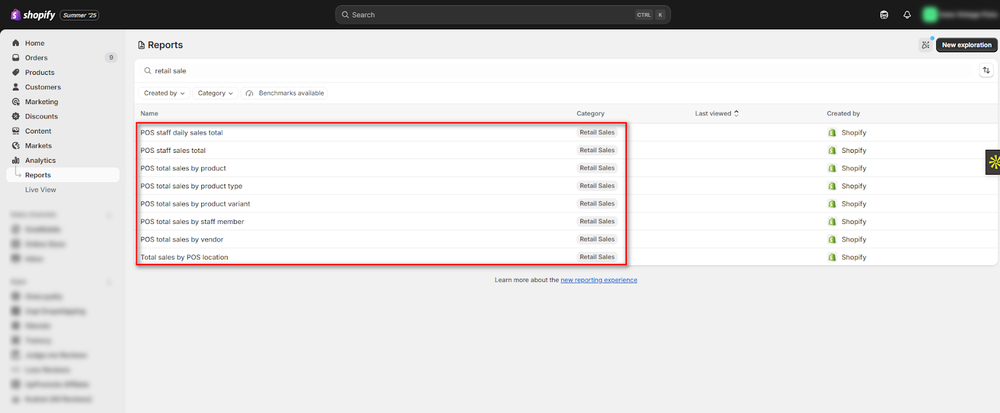
7. Retail Sales Reports
If you’re selling in-person, retail sales reports are your secret weapon.
They show which products fly off the shelves (and which don’t), which locations pull in the most sales, and how your staff performs at the register.
You’ll know exactly which products to stock at each location, and which team members might need extra training—or a high-five for crushing their goals.
Retail Sales Report Types to Run:
Key Metrics:
Key Metrics | What It Tracks |
|---|---|
POS staff daily sales total | Tracks daily total sales per staff member to monitor individual performance. |
POS staff sales total | Tracks total sales per staff member over time for overall performance insights. |
POS total sales by product | Tracks total sales of each product in POS to see top-performing products. |
POS total sales by product type | Tracks total sales by product category in POS to assess category performance. |
POS total sales by product variant | Tracks sales of product variants (size, color) in POS for granular insights. |
POS total sales by staff member | Tracks total sales by each staff member in POS for performance summaries. |
POS total sales by vendor | Tracks sales of products by vendor in POS to evaluate vendor performance. |
Total sales by POS location | Tracks total sales by each POS location to compare store performance. |
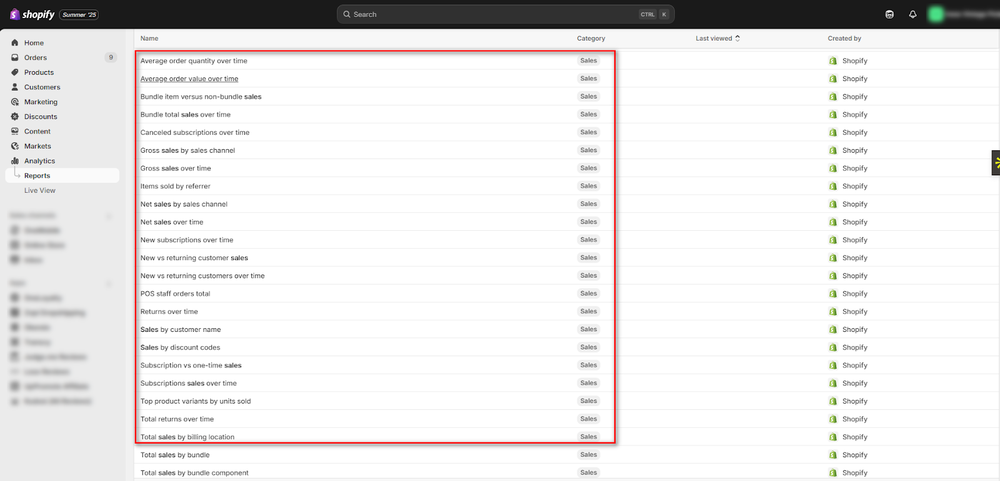
8. Sales Reports
Sales reports show you order data by product, sales channel, and more—while taking returns into account so you get a true picture of your net sales.
Returns appear as negative values on the day they’re processed, giving you accurate sales tracking over time.
Sales Report Types to Run:
Key Metrics:
Key Metrics | What It Tracks |
|---|---|
Average order quantity over time | Tracks average items per order over time to analyze purchasing trends. |
Average order value over time | Tracks average order value over time to understand spending habits. |
Bundle item vs non-bundle sales | Tracks sales of items in bundles vs. sold separately to assess bundling effectiveness. |
Bundle total sales over time | Tracks total revenue from product bundles over time. |
Canceled subscriptions over time | Tracks number of canceled subscriptions over time to monitor churn. |
Gross sales by sales channel | Tracks total revenue by sales channel to evaluate channel performance. |
Gross sales over time | Tracks total sales revenue over time before deductions. |
Items sold by referrer | Tracks which items sold based on referral sources. |
Net sales by sales channel | Tracks net revenue (after returns/discounts/taxes) by sales channel. |
Net sales over time | Tracks net revenue over time after returns, discounts, and taxes. |
New subscriptions over time | Tracks new subscriptions acquired over time. |
New vs returning customer sales | Tracks sales from new vs. returning customers to assess acquisition vs. retention. |
New vs returning customers over time | Tracks new vs. returning customers over time to monitor customer base growth. |
POS staff orders total | Tracks total orders processed by each POS staff member. |
Returns over time (also known as ecom return rates) | Tracks total returns processed over time. |
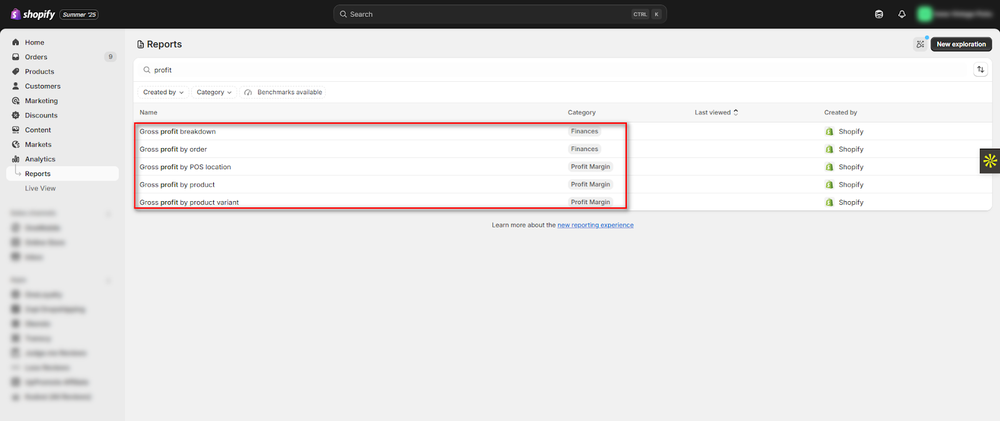
9. Profit Report
Profit reports (also known as PnL reports) show you exactly how money flows in and out of your store so you can see what’s actually left after expenses.
Think of them as your built-in cash flow truth detector. Track costs, gross profit margins in one place—so you know which products actually make you money and which ones quietly drain your cash.
Profit Report Types to Run:
Key Metrics:
Key Metrics | What It Tracks |
|---|---|
Gross profit breakdown | Tracks components of gross profit by segmenting revenue and COGS. |
Gross profit by order | Tracks gross profit per individual order for granular profitability insights. |
Gross profit by POS location | Tracks gross profit from each POS location to assess store profitability. |
Gross profit by product | Tracks gross profit by product to identify and optimize top performers. |
Gross profit by product variant | Tracks gross profit by product variant (size, color) for detailed insights. |
Shopify Report vs. Shopify Analytics: What Differs?
Shopify reports tell you what’s happening in your store. Analytics help you find patterns and actionable insights.
Shopify analytics help you more with the “why” part, where you spot the hidden gem that can move your profit needle.
Sure, diving deeper can feel overwhelming. But it’s where you’ll find:
- Hidden problems draining your profit.
- Quick wins to boost your conversions and UX.
- Clear answers to the questions that actually move your business forward.

Beyond Standard Shopify Reports: Taking Profit Tracking to the Next Level
While the 7 Shopify report types we've covered give you valuable insights into your store's performance, many ecommerce businesses quickly discover gaps—especially when it comes to comprehensive profit tracking.
Standard Shopify reports show you gross profit, but they often miss the full picture of your true profitability after factoring in all costs like multi-channel ad spend, transaction fees, and shipping expenses.
This is where TrueProfit steps in to fill those critical gaps.
TrueProfit automatically tracks these key reports for you, with profit as the north star! Built specifically as a profit analytics co-pilot for Shopify sellers who want to grow with clarity, TrueProfit goes beyond what standard Shopify reporting can show you.
What you can get out of TrueProfit:
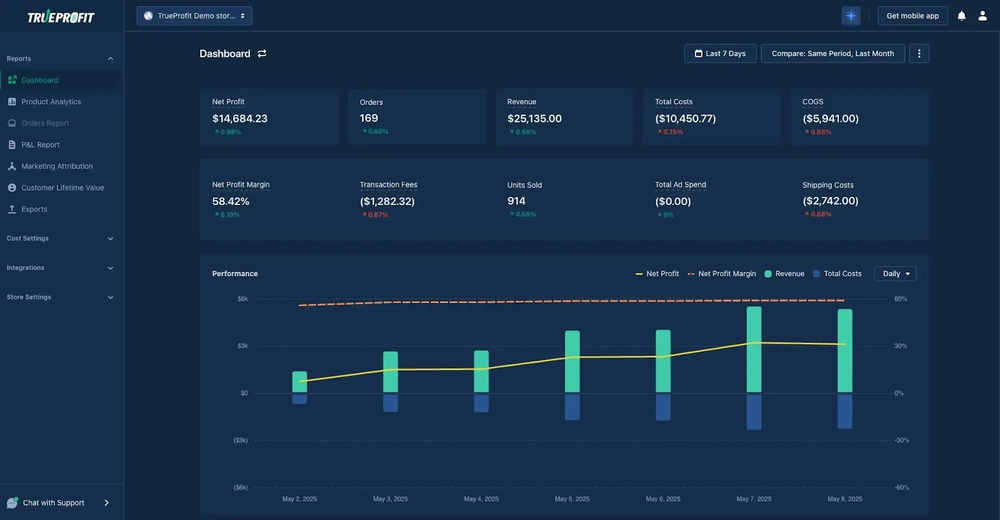
TrueProfit helps merchants see their Net profit at multiple levels: storewide, product-level, and ad-level—something Shopify's native reports simply can't deliver.
- Real-time Net Profit Dashboard – Unlike Shopify's delayed reporting, see your true profitability as transactions happen, with live updates on actual margins after all costs
- Auto-track all costs – While Shopify only shows gross sales, TrueProfit automatically captures COGS, multi-channel ad spend, shipping fees, transaction costs, and hidden expenses that Shopify reports miss entirely
- Profit-based Product Analytics & MKT Attribution – Go beyond Shopify's basic sales data to see which products and marketing channels actually generate profit, not just revenue
- Comprehensive P&L Report – Get complete profit and loss tracking with detailed cost breakdowns—a level of financial insight that Shopify's standard reports don't provide
- True Customer Lifetime Value – Calculate real CLV including acquisition costs across all channels, while Shopify's CLV reports ignore your actual marketing spend
- Mobile app, All-store view – Access profit-focused insights anywhere with intelligent recommendations, while Shopify's mobile reporting remains limited to basic sales metrics
The bottom line: Shopify tells you what you sold. TrueProfit tells you what you actually earned.
Pricing: It offers 14 days trial with paid plans starting at $35/ month.
Shopify Reports FAQs

Harry Chu is the Founder of TrueProfit, a net profit tracking solution designed to help Shopify merchants gain real-time insights into their actual profits. With 11+ years of experience in eCommerce and technology, his expertise in profit analytics, cost tracking, and data-driven decision-making has made him a trusted voice for thousands of Shopify merchants.