Contribution Margin 101: Definition, Formula, and Real Business Impact

Table of Contents
Contribution margin tells you how much revenue is left from each sale after covering variable costs. That remainder goes toward paying fixed costs and, eventually, generating profit. It's one of the most actionable numbers in your business because it cuts through the noise and shows exactly how profitable each sale is at the unit level.
This guide covers the definition, formulas, real examples, benchmarks, and strategies to improve your contribution margin with a focus on eCommerce.
In this blog:
What Is Contribution Margin?
Contribution margin is the revenue left over after subtracting all variable costs from a sale. In other words, it's what each order actually contributes toward covering your fixed costs, and eventually, generating profit.
It's a different lens than net profit. Net profit tells you how the business performed overall after every expense. Contribution margin tells you how profitable each individual unit or transaction is, before fixed costs enter the picture.
That distinction matters. A product can look profitable in aggregate but quietly drain margin at the unit level. The contribution margin is what surfaces.
Variable Costs vs. Fixed Costs
To calculate and understand contribution margin, you need to separate two types of costs.
Variable costs are the costs that scale with sales volume. Every order you fulfill generates these expenses, the more you sell, the more you pay, though the cost per unit stays roughly constant. For ecommerce merchants, these typically include:
- Cost of goods sold (COGS)
- Shipping and fulfillment fees
- Payment processing fees
- Sales commissions and per-click ad spend
- …
Fixed costs stay constant regardless of volume. Rent, salaries, software subscriptions, and insurance don't change whether you ship 10 orders or 10,000. Because they don't move with sales, they're excluded from the contribution margin calculation entirely.
This separation is what makes contribution margin useful, it isolates the unit-level economics of your business, so you can evaluate products, prices, and campaigns on their own terms.

How to Actually Calculate Contribution Margin
Contribution margin can be calculated at the total level or per unit. Both are useful, they just answer different questions.
Total Contribution Margin
This shows how much revenue across all sales is available to cover fixed costs.
Contribution Margin Per Unit
This shows how much a single sale contributes. Use this for pricing decisions and product level analysis.
Here is an example for ecommerce store
For example you’re running a T-shirt store:
Item | Amount |
|---|---|
Sales price per unit | $30.00 |
COGS (blank and printing) | $8.00 |
Packaging | $1.00 |
Shipping | $5.00 |
Payment processing (3.5%) | $1.05 |
Variable ad spend per sale | $2.00 |
Total variable cost per unit | $17.05 |
Contribution margin per unit | $12.95 |
At 500 units sold per month:
- Total revenue: $15,000
- Total variable costs: $8,525
- Total contribution margin: $6,475
The Signals Hidden in Your Contribution Margin
Most financial metrics show you the outcome. Contribution margin shows you the mechanics behind it.
Where your business model is strong and where it isn't
Aggregate revenue can hide a lot. Contribution margin breaks that down to the unit level, revealing which parts of your business are structurally profitable and which are propped up by volume alone.
How much of each sale you actually keep
Contribution margin shows how much revenue from each sale remains after all variable costs, such as COGS, shipping, and transaction fees, are covered. That remaining amount is what each order contributes toward paying fixed expenses and generating profit, making it much easier to judge whether your pricing and cost structure actually work.
Which costs are eating your margin without you noticing
Rising fulfillment rates, higher payment processing fees, creeping ad costs, these erode margin gradually. Tracking contribution margin over time makes those shifts visible before they become a real problem.
How resilient your business is to change
When sales slow down, prices shift, or costs increase, contribution margin tells you how much buffer you have. A business with thin margins has very little room to absorb change. A business with healthy margins has options.
The use cases below show how to act on each of these signals.
How Ecommerce Merchants Use Contribution Margin
Knowing your contribution margin is one thing. Knowing how to act on it is another. Here's how it shows up in real decisions.
Use Case 1: Setting a Break-Even Target Before You Launch
Before a new product goes live, the contribution margin tells you exactly how many units you need to sell to cover your fixed costs, no guesswork involved.
- Break-even in units = Total Fixed Costs ÷ Contribution Margin Per Unit
- Break-even in revenue = Total Fixed Costs ÷ Contribution Margin Ratio
If your fixed costs run $10,000/month and your contribution margin per unit is $12.95, you need 773 sales to break even. That becomes your baseline target for forecasting, ad budgeting, and inventory planning, before you've spent a dollar.
Use Case 2: Deciding How Far You Can Discount
Every promotion has a floor, the point where cutting price stops making sense on a variable cost basis. The contribution margin shows you exactly where that floor is.
This matters when setting launch prices, planning seasonal sales, or evaluating whether a bundle offer actually improves margins or just moves units. Without it, discount decisions are intuition dressed up as strategy.
For example, if a product sells for $100 and its variable costs total $65, your contribution margin is $35. A 10% discount still leaves $25 to cover fixed costs and profit, but a 40% discount cuts that to - $5, meaning every sale loses money before fixed costs are even considered.
Use Case 3: Identifying Which Products to Scale and Which to Cut
Two products can generate similar revenue while producing very different margins. One might carry higher shipping costs, heavier ad spend, or more returns.
For example, if one product has a 60% contribution margin while another delivers only 15%, the higher-margin product has much more room to absorb discounts, rising ad costs, or unexpected expenses while remaining profitable. The lower-margin product leaves little buffer, making it much riskier to scale.
That's why high-margin products often deserve more inventory investment and ad budget, while low or negative-margin products may need to be repriced, have costs reduced, be bundled more strategically, or even be discontinued. Without contribution margin data, it's easy to invest in products that drive revenue but contribute little to your bottom line.
Use Case 4: Evaluating Whether a Campaign Actually Made Money
Revenue and ROAS don't tell the full story. A campaign that drives strong sales volume at near-zero contribution margin doesn't improve your business, it just adds noise.
Comparing customer acquisition cost (CAC) against the contribution margin generated per customer gives you a clearer read. If the margin doesn't cover what it cost to acquire the customer, the campaign didn't work regardless of what the dashboard shows.
Use Case 5: Allocating Budget Where It Compounds
When you're choosing where to invest, ad spend, inventory, operational resources, contribution margin is the signal that tells you where returns will compound and where they'll disappear.
This is more useful than relying on operating profit or net income alone, which blend fixed costs in ways that obscure product-level performance. Used alongside your P&L statement and balance sheet, contribution margin separates unit-level efficiency from overall financial performance, giving you a cleaner basis for every major resource decision.

What Is A Good Contribution Margin Ratio?
The contribution margin ratio converts your dollar figure into a percentage of revenue. This makes it easier to compare across products, periods, or competitors.
How to Calculate the Ratio
Contribution Margin Ratio = (Contribution Margin / Sales Revenue) x 100
You can use either total figures or per unit figures the result is the same.
For example:
T shirt: $12.95 / $30 = 43.2% This means 43 cents of every dollar in t-shirt sales goes toward fixed costs and profit.
What is a good contribution margin ratio for ecommerce?
There's no one-size-fits-all answer. A "good" contribution margin depends on what you sell, your pricing strategy, and how much it costs to fulfill each order. That said, these benchmarks are a useful place to start:
60% or higher: Strong
- You're keeping a healthy share of each sale after variable costs.
- You have more flexibility to invest in ads, run promotions, and grow without putting too much pressure on profitability.
30–60%: Healthy
- This is a common range for many ecommerce businesses.
- Your margins are generally solid, but there's still room to improve through better pricing, lower fulfillment costs, or higher average order values.
Below 30%: Worth investigating
- A large portion of your revenue is being eaten up by variable costs.
- As ad costs, shipping fees, or discounts increase, it becomes much harder to grow profitably. It's worth reviewing your pricing, supplier costs, shipping strategy, or whether some products should be repositioned or removed.
Contribution Margin vs. Gross Margin vs. Net Profit Margin: What Are The Differences?
These three metrics all measure profitability, but they sit at different points in your P&L and answer different questions. Confusing them leads to bad decisions.
Here's how to keep them straight.
How Each Metric Is Calculated
- Gross profit margin subtracts Cost of Goods Sold (COGS) from revenue. COGS includes direct materials, direct labor, and manufacturing overhead some of which is fixed.
- Contribution margin subtracts all variable costs from revenue including variable selling and marketing expenses but excludes every fixed cost entirely.
- Net profit margin subtracts all types of costs: variable costs, fixed costs, operating expenses, interest, and taxes. It's the final bottom line as a percentage of revenue.
How The Metrics Compare Side by Side
Let's break down the differences so you can quickly see what each metric measures and when to use it.
Aspects | Contribution Margin | Gross Profit Margin | Net Profit Margin |
|---|---|---|---|
Costs deducted | All variable costs (COGS, shipping, commissions, ad spend) | COGS only (includes fixed manufacturing overhead) | All costs: variable, fixed, operating, interest, taxes |
Fixed costs included? | No | Partially (fixed manufacturing overhead via COGS) | Yes, fully |
Variable selling costs included? | Yes | No | Yes |
Where it sits in the P&L | Above gross profit | After revenue, before operating expenses | Bottom line |
Primary use | Pricing, break even, product level decisions | Production efficiency, external reporting | Overall business profitability |
Best for | Internal tactical decisions | Benchmarking against competitors | Investor reporting, strategic planning |
Typical eCommerce range | 30–50% | 60-70% | 10-20% |
Take the t-shirt store from earlier: $30 selling price, $17.05 in variable costs, and assume $3,000/month in fixed costs (rent, software, salaries) across 500 units.
- Contribution margin per unit: $30 minus $17.05 = $12.95 (43.2%)
- Gross margin per unit: $30 minus $8 COGS = $22.00 (73.3%) shipping, ad spend, and fees aren't in COGS
- Net profit margin: ($6,475 total contribution minus $3,000 fixed costs) / $15,000 revenue = $3,475 / $15,000 = 23.2%
This illustrates a key point: gross margin can look strong while net profit is much thinner, because it excludes costs that contribution margin and net margin both capture.
When to Use Each Metric
Use contribution margin for day to day operational decisions: setting prices, evaluating promotions, deciding which products to cut or scale. It isolates unit level profitability without fixed cost noise.
Use gross margin when benchmarking against competitors or reporting to investors. Gross profit margin is the standard metric on income statements and gives a clean view of production efficiency.
Use net profit margin to assess whether the entire business is viable after every cost is paid. It's the number that matters for long term sustainability. For a deeper look at how gross and net sit in relation to each other, see gross profit vs. net profit.
The most useful approach is to track all three. Contribution margin flags product level issues. Gross margin shows production efficiency. Net profit margin tells you whether the business as a whole is working.
How to Perform a Contribution Margin Analysis (Step by Step)
Here's the process I'd recommend for a full analysis across your product catalog. Five steps, in order.
1. Identify and Categorize Your Costs
Start by listing every cost your business incurs and classifying each one as fixed or variable. The rule of thumb: if the cost goes up with each additional unit sold, it's variable. If it stays flat regardless of volume, it's fixed.
2. Collect Revenue Data
Next, you need to collect revenue data for each product, order, or segment you’re analyzing.
Whenever possible, you should use net sales, which means revenue after accounting for discounts, refunds, and returns. If you rely on gross revenue instead, your margins may look artificially higher than they actually are.
3. Calculate CM for Each Product
Use the formula mentioned above:
Contribution Margin = Revenue - Variable Costs
You can calculate this as a total, per unit, or percentage.
For product comparisons, the contribution margin ratio is often the clearest metric because it normalizes performance across different price points.
4. Rank and Compare
Once you calculate contribution margin, rank your products from highest to lowest.
Look for:
- Products with strong revenue and strong contribution margin
- Products with high revenue but weak contribution margin
- Products with low revenue but strong contribution margin
- Products with negative contribution margin
This ranking helps you decide where to focus.
Flag anything with a negative CM. Those products lose money on every sale. Doesn't matter how much volume you push. They're costing you.
5. Track Trends Over Time
You should compare margins month over month or quarter over quarter to catch erosion early. Common culprits include rising supplier costs, carrier rate increases, and heavier discounting during promotional periods.
6. Make Decisions
This is the step most businesses skip. And it's the one that delivers the most impact.
With ranked, time-trended CM data in hand, you now have a factual basis for deciding whether to:
- Raise prices
- Reduce discounts
- Renegotiate supplier costs
- Change packaging
- Improve shipping rates
- Reallocate ad spend
- Promote higher-margin products
- Bundle products strategically
- Discontinue products with consistently negative margins
Key Factors That Affect Your Contribution Margin
Four factors drive your contribution margin up or down. Understanding each one gives you clear levers to pull.
1. Selling Price
Price is the most direct lever. Raising prices without a corresponding increase in variable costs improves contribution margin immediately. But price elasticity matters if a price increase drives away enough customers, total contribution margin can fall even if the per unit margin rises.
The goal is to maximize total contribution margin (price × volume), not just the per unit number.
2. Variable Costs
Every cost that scales with sales volume directly affects your margin. The main categories to watch:
- COGS: Raw material price increases or supplier changes hit immediately
- Shipping and fulfillment: Rate changes or carrier switches can shift margins by several percentage points
- Payment processing: Most processors charge 2–3.5% per transaction
- Performance marketing: Cost per click or cost per acquisition tied directly to sales
Monitoring these regularly prevents margin erosion from slowly accumulating unnoticed.
3. Sales Volume
Volume doesn't change contribution margin per unit, but it changes your total contribution margin and can unlock cost improvements. Higher volume often means better supplier pricing, more favorable shipping rates, or lower per unit fulfillment costs all of which improve your margin indirectly.
Higher volume also spreads fixed costs thinner, getting you to profitability faster. The interplay between volume, margin, and fixed costs is central to understanding revenue growth vs. profit growth.
4. Operational Efficiency
Reducing waste, automating manual processes, or renegotiating supplier contracts all lower variable costs per unit without changing your price. Efficiency gains are durable; they improve contribution margin on every unit sold going forward.
How to Improve Contribution Margin
These strategies are specific to eCommerce businesses. Choose based on where your biggest margin leak is.
1. Adjust Pricing Strategically
Don't just raise prices across the board. Consider:
- Value based pricing: Charge what the product is worth to the customer, not just what it costs to make. If customers see high value, they'll pay for it.
- Bundle pricing: Pairing a high margin item with a lower margin item in a bundle can increase average order value and overall contribution margin.
2. Cut Variable Costs
- Renegotiate with suppliers annually, especially as your volume grows
- Switch fulfillment partners or shipping carriers if your current rates have crept up
- Automate variable labor tasks in production, support, or fulfillment
- Buy in bulk where storage costs allow the per unit savings add up quickly
3. Increase Product Value
Better products command higher prices. For eCommerce, improved materials, packaging, or branding can shift perception and support premium pricing without meaningfully increasing variable costs.
4. Streamline Operations
Reducing returns and defects cuts the hidden variable costs that rarely show up clearly in reporting. A 5% return rate on a $30 product at $17 in variable costs means you're losing on every return. Tightening quality control pays directly into contribution margin.
Final Thoughts
Contribution margin is one of the clearest ways to understand what’s really happening at the unit level in your business.
It shows you whether each sale is actually contributing to profit, or just driving more revenue without meaningful returns. Once you start looking at your numbers this way, decisions around pricing, products, and marketing become much more grounded.
But it’s important to remember: contribution margin is only part of the picture.
At the end of the day, net profit is what really matters. It tells you whether your business is actually making money after all costs are accounted for, not just the variable ones.
So the goal isn’t just to improve contribution margin. It’s to translate that into stronger, more sustainable net profit.

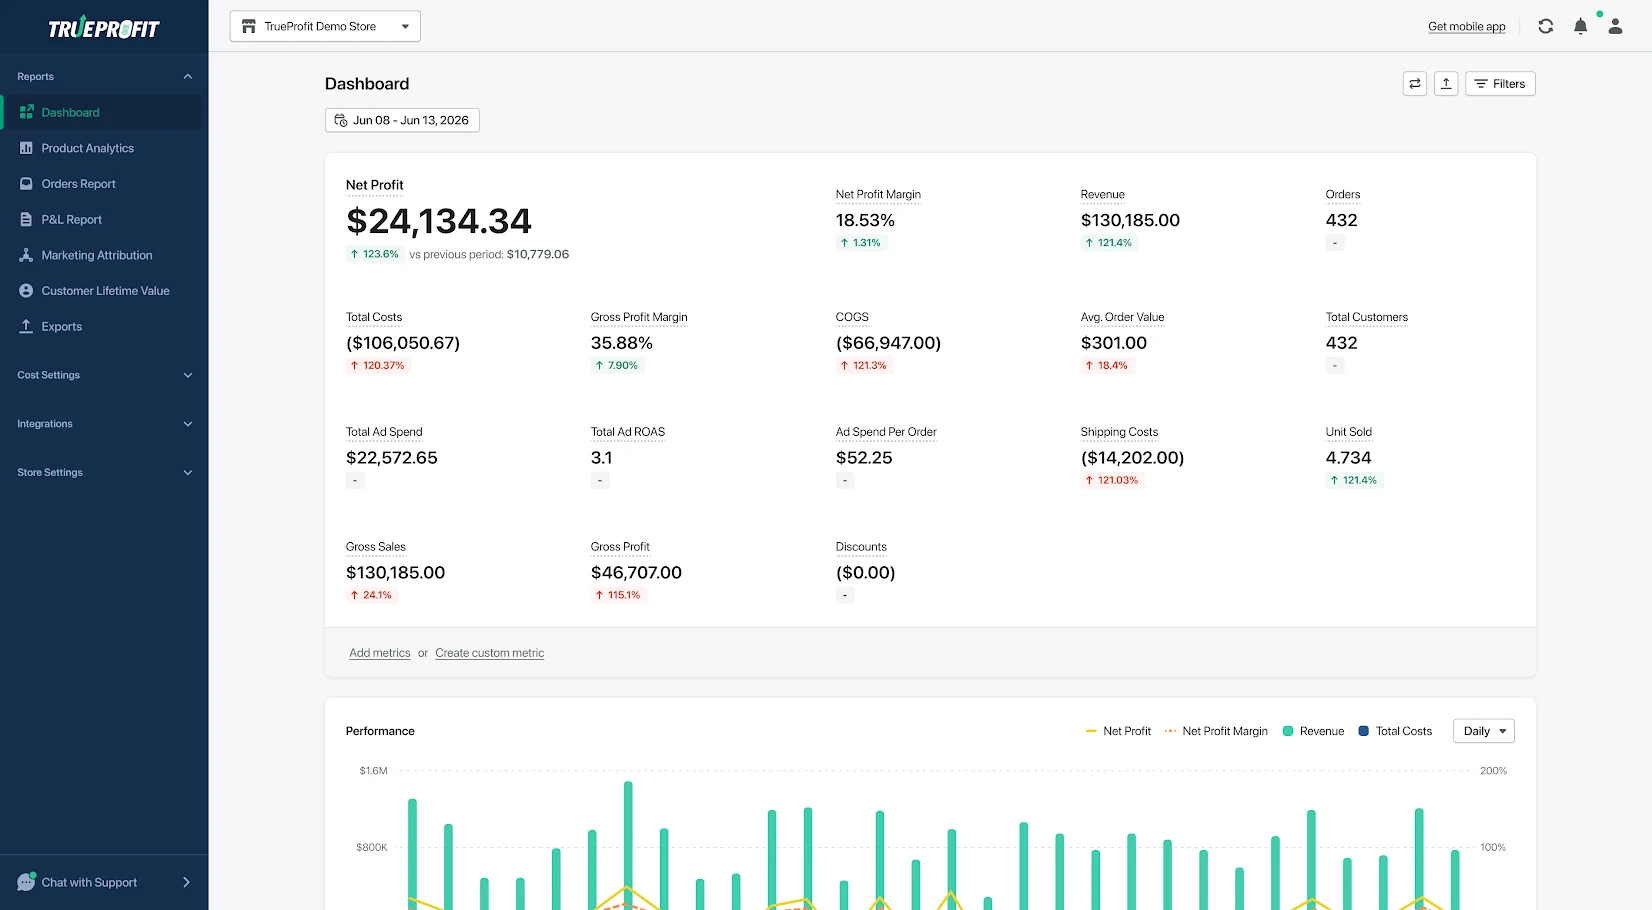
For Shopify sellers, that’s where tools like TrueProfit become useful. Instead of only thinking in terms of margins, you get a clear, real-time view of your actual net profit across products, orders, and channels, so you can make decisions based on what’s really driving profitability, not just revenue or partial cost breakdowns.


Harry Chu is the Founder of TrueProfit, a net profit tracking solution designed to help Shopify merchants gain real-time insights into their actual profits. With 11+ years of experience in eCommerce and technology, his expertise in profit analytics, cost tracking, and data-driven decision-making has made him a trusted voice for thousands of Shopify merchants.