What is Product Profitability Analysis? Examples & Proven Methods

Table of Contents
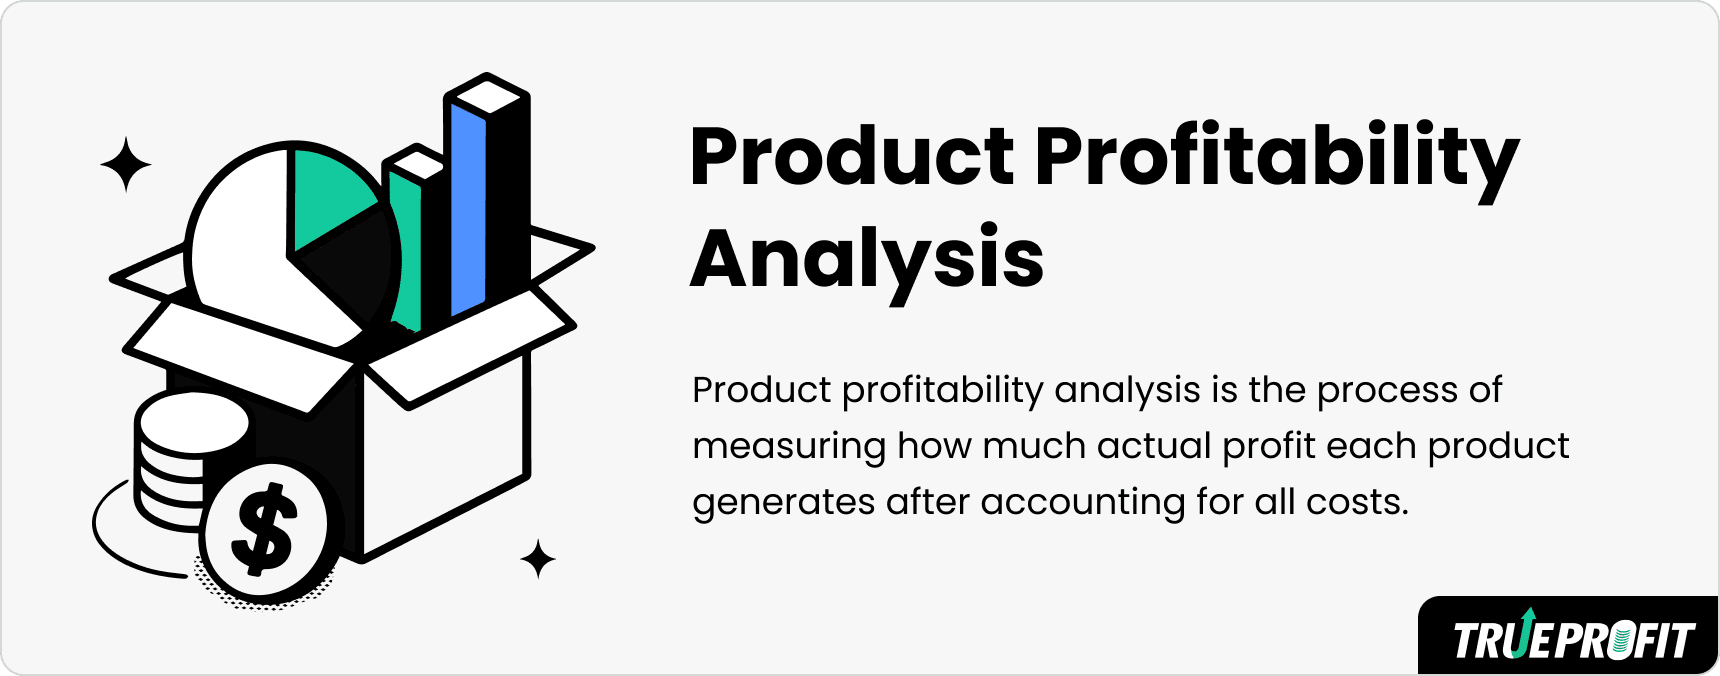
Product profitability analysis is the process of measuring how much profit each product generates after accounting for all costs. That includes COGS, marketing, shipping, transaction fees, refunds, and more.
It’s a key tool for business to see which products truly contribute to the bottom line — and which ones just look good on the surface.
This guide covers product profitability analysis definition, real-life brand examples, and practical ways to run your own analysis.
Let’s break it down.
In this blog:
What is Product Profitability Analysis?
Product profitability analysis is the process of measuring how much actual profit each product generates for your business after accounting for all associated costs.

This includes obvious costs like:
- Cost of goods sold (COGS),
- Shipping costs,
- Discounts or refunds,
- Marketing/ad spend,
- Platform or transaction fees.
The goal is to uncover which products are driving your profit vs. which ones might be secretly draining your resources. It helps you stop relying on revenue or order volume as your success metric and start focusing on what truly matters: profit per product.
Product profitability analysis is a decision-making tool—use it to:
- Kill unprofitable SKUs
- Adjust pricing
- Reallocate ad spend
- Or double down on high-margin winners

Example of Product Profitability Analysis
Here’s a simplified example of how a business might analyze its product profitability.
Meet TechGadgets Inc. They sell two flagship products:
- SmartWatch X: a high-end smartwatch
- BudgetPhone Y: an affordable smartphone
At the end of the year, the company PnL report looks like:
- Net income: $100,000
- Ad spend: $80,000
- Revenue: $700,000
- Operating income: $120,000
To perform a product profitability analysis, they break down the revenue, costs, and ad spend associated with each product.
1. Net Profit Calculation (per product)
First, they calculate the net profit for each product. This involves subtracting the cost of goods sold (COGS) and operating expenses from the revenue generated by each product.
SmartWatch X
- Revenue: $400,000
- COGS: $200,000
- Operating Expenses: $50,000
- Net Profit: $150,000
BudgetPhone Y
- Revenue: $300,000
- COGS: $150,000
- Operating Expenses: $30,000
- Net Profit: $120,000
👉 So far, SmartWatch X is leading.
2. Net Profit on Ad Spend (per product)
Next, they calculate the Net Profit on Ad Spend for each product. This metric shows how much profit is generated for every dollar spent on advertising.
SmartWatch X
- Ad Spend: $50,000
- NPAS: $150,000 ÷ $50,000 = 3.0x
BudgetPhone Y
- Ad Spend: $30,000
- NPAS: $120,000 ÷ $30,000 = 4.0x
Both products are profitable, but BudgetPhone Y delivers more profit per ad dollar. For every dollar spent on advertising BudgetPhone Y, the company generates $4 in profit, compared to $3 for SmartWatch X.
3. Operating Profit Margin (per product)
Finally, they calculate the Operating Profit Margin for each product. This metric indicates the percentage of revenue that remains after accounting for COGS and operating expenses.
SmartWatch X
- Operating Profit Margin: (400,000 - 200,000 - 50,000) ÷ 400,000 = 37.5%
BudgetPhone Y
- Operating Profit Margin: (300,000 - 150,000 - 30,000) ÷ 300,000 = 40%
BudgetPhone Y again shows a good operating profit margin. For every dollar of revenue generated by BudgetPhone Y, the company keeps 40 cents as operating profit, compared to 37.5 cents for SmartWatch X.
Even though both products have the same gross profit margin (50%), SmartWatch X is a higher-ticket or higher-volume item. So its gross profit is $200,000, while BudgetPhone Y only brings $150,000.
Remember, there’s no one-size-fit-all method.
What are Product Profitability Analysis Methods?
There’s more than one way to figure it out. Let’s look at six proven methods.
1. Product-Level Cost Analysis
Break down every cost tied to each product: COGS, packaging, fulfillment fees, shipping, and any hidden handling charges.
Why does this matter? Because some products that look profitable based on revenue alone could be quietly eating into your margins. If you want to spot silent killers in your catalog, this method is a must.
2. Contribution Margin Analysis
What if your variable costs fluctuate? That’s where contribution margin analysis comes in. Instead of only looking at gross profit, you subtract variable costs to see what each product truly contributes to your bottom line.
This approach helps you catch the sneaky products that might sell like hotcakes... but generate little real return.
3. Net Profit on Ad Spend (NPAS)
Just because a product performs well in ads doesn’t mean it’s profitable.
This method tracks how much net profit you actually make per product — after ad costs are subtracted. It’s especially useful if you rely on paid traffic, like Meta or TikTok.
4. CLV-to-CAC Analysis by Product
Some products attract customers who only buy once. Others bring in loyal buyers who come back again and again. This method compares the customer lifetime value (CLV) of buyers by product with the customer acquisition cost (CAC).
The goal? To find out which products bring in your most valuable customers.
5. Pricing Sensitivity Testing
What happens when you tweak the price of a product? Pricing sensitivity testing lets you see how demand responds. Sometimes, raising prices slightly can actually lead to higher profits, especially for niche or high-perceived-value items.
It's one of the fastest ways to test your pricing strategies.
6. ABC Profitability Segmentation
Last but not least, let’s talk about product prioritization. Not every SKU deserves the same attention — and this method helps you focus. Group your products into three tiers:
- A products = high-profit, high-volume
- B products = moderate contributors
- C products = low-profit or loss leaders
With this breakdown, you’ll instantly see where to double down and what to cut loose.
Why Product Profitability Analysis Matters?
Not every best-seller is your most profitable product. And not every slow-moving item is a waste of shelf space.
That’s why product profitability analysis matters. It gives you clarity on what’s actually driving your bottom line.
When you know which products bring in the most profit — after all costs are accounted for — you can make smarter decisions. Like where to spend your ad budget. Which items to upsell. Or which SKUs to discontinue.
It also helps you avoid one common trap: chasing revenue while profit quietly disappears. A product might generate thousands in sales but leave you with pennies after discounts, shipping, and returns. Or, in the words of TrueProfit’s founder, Harry Chu: “Chasing revenue is easy. You’ve got ads, influencers, discounts… the internet’s full of tactics. Take your pick and your sales look impressive soon or later. The real challenge is when you try to grow sales while keeping profit margins healthy. That’s where tracking true profit is everything.”
With a proper analysis, you can spot hidden winners. Sometimes it’s a product with modest sales but excellent margins. Or one that drives repeat customers who later buy higher-ticket items.
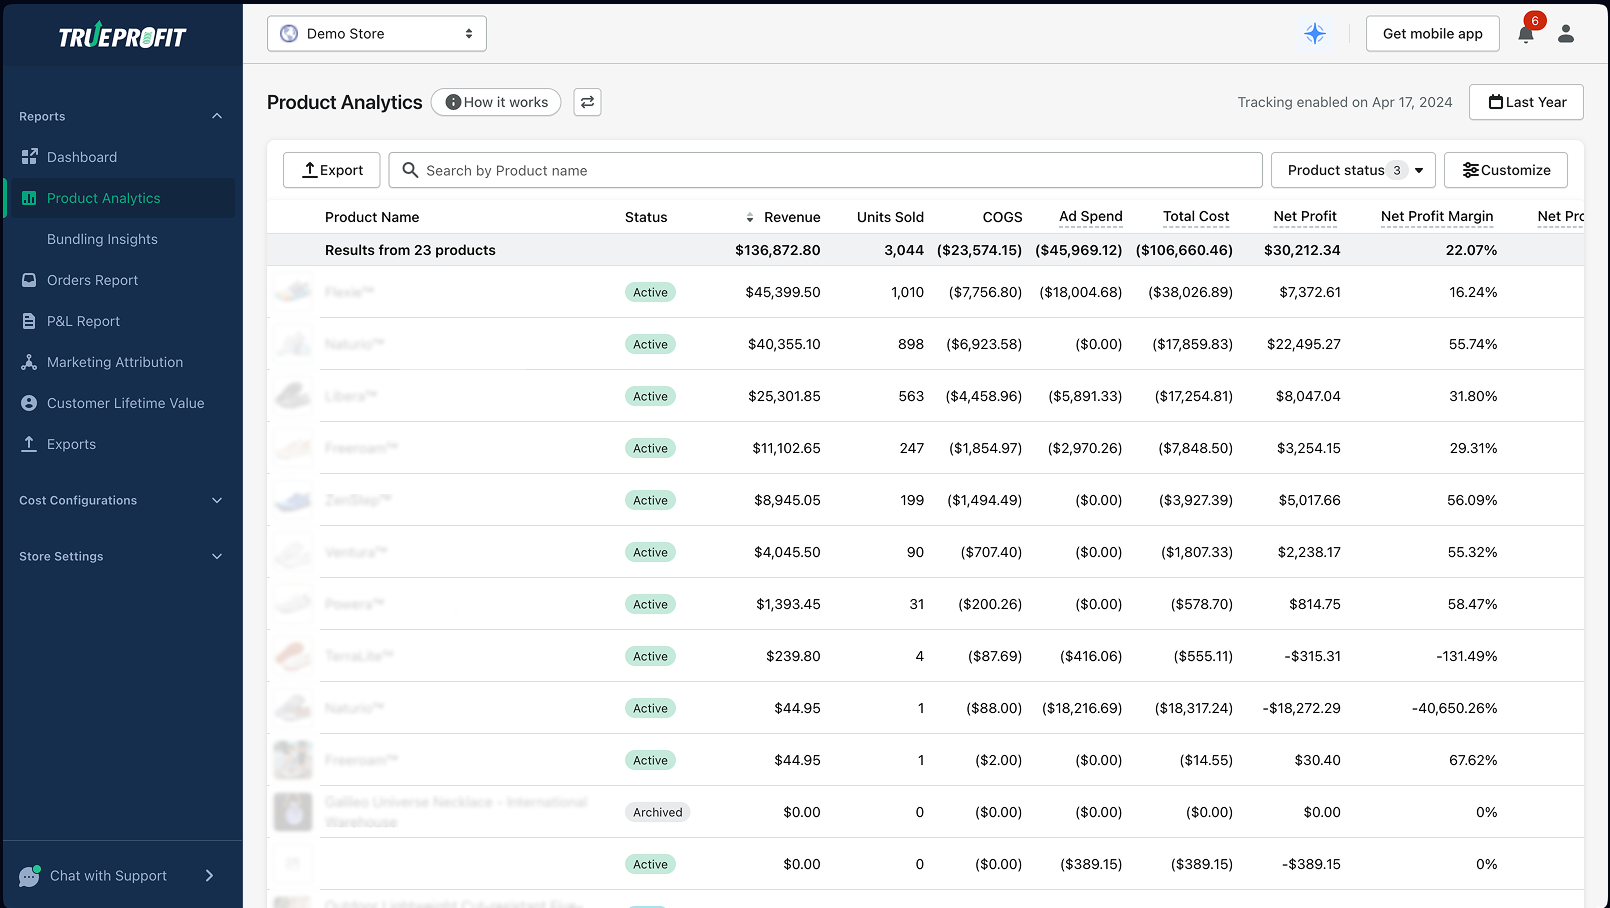
At the end of the day, knowing your most profitable products helps you double down on what works. If you’re a Shopify merchant, TrueProfit makes this easy with built-in product analytics — tracking your profit per SKU after every cost, in real time.
By tracking profit-based metrics alongside SKU-level COGS, TrueProfit helps you:
- Spot which products bring in the highest true profit
- See how much profit each product actually makes after ad spend.
- Catch items that look good on revenue, but quietly eat away your margin.
- Compare margins across your product to decide where to scale or cut back.
All without spreadsheets, all in real time.
👉 Start your free trial with TrueProfit!


Leah Tran is a Content Specialist at TrueProfit, where she crafts SEO-driven and data-backed content to help eCommerce merchants understand their true profitability. With a strong background in content writing, research, and editorial content, she focuses on making complex financial and business concepts clear, engaging, and actionable for Shopify merchants.