Year to Date Profit and Loss Statement: A Complete Guide (2026)
Table of Contents
A year to date (YTD) profit and loss statement shows how your business is performing right now, not just at the end of a period. It tracks your revenue, costs, and profit from the beginning of your fiscal year up to today, giving you a real-time view of your financial health.
For Shopify store owners, this isn’t just a report. It’s a decision-making tool. You can quickly see if you’re profitable, where your money is going, and whether you’re on track to hit your targets.
In this guide, you’ll learn exactly what a YTD profit and loss statement is, why it matters, how to create one, and how to use it to make smarter financial decisions.
In this blog:
What Is a Year to Date Profit and Loss Statement?
A year-to-date (YTD) profit and loss statement is a financial report that shows your total income, expenses, and profit from the start of your fiscal year up to today.
Instead of focusing on a single month or a full past year, it gives you a running view of performance. This makes it easier to track progress, spot issues early, and adjust your strategy before problems grow.
A YTD P&L gives you a real-time view of where your business is heading. You do not have to wait until the end of the year. You can see mid-year if you are on track, overspending, or performing better than expected.
That visibility is what turns it into a management tool, not just a reporting document. It combines two ideas: the YTD time frame and the structure of a P&L statement (income statement).

Why Your Business Needs a YTD P&L Statement
The YTD P&L does more than satisfy your accountant. It drives better decisions across budgeting, strategy, fundraising, and taxes.
1. Tracking Performance Against Goals
The most direct use is to compare your actual YTD numbers to your annual targets. If you projected $500K in revenue by June and you're at $380K, that gap is a signal to act now, not in December.
It also surfaces seasonal patterns early. If revenue spikes every March and tanks in August, you'll see it in the YTD data and can plan inventory or marketing spend accordingly.
2. Smarter Budgeting and Forecasting
When your YTD expenses are running 15% above budget, you know before the year is over. You can tighten spending, adjust forecasts, and avoid a year-end shortfall.
Understanding the difference between revenue growth vs. profit growth is especially useful here. Revenue can climb while profitability shrinks if costs aren't managed. Your YTD P&L will show both sides.
3. Attracting Loans and Investment
Lenders and investors want to see current performance, not just last year's tax return. A YTD P&L shows them exactly what your business is earning and spending right now.
Self-employed individuals applying for a mortgage often need to provide a YTD P&L as proof of income stability. It supplements annual filings with up-to-date evidence of earning capacity.
4. Tax Planning Throughout the Year
Tracking profit YTD lets you estimate your taxable income before year-end. That means you can plan quarterly tax payments accurately and avoid a surprise bill in April.
5. Business Valuation
If you're looking to sell, raise capital, or simply understand what your business is worth, potential buyers and investors will use your YTD P&L to gauge current operational profitability. It's often more relevant to them than historical data.
Key Components of a YTD Profit and Loss Statement
Every YTD P&L follows the same structure. Here's what each line means and why it matters.
1. Revenue
Revenue is the top line. It shows total income from your primary business activity. Gross revenue captures everything before deductions. Net revenue is what remains after returns, allowances, and discounts.
The net revenue figure is what P&L calculations actually use. If you're an ecommerce seller with a 12% return rate, the difference between gross and net can be significant.
2. Cost of Goods Sold (COGS)
COGS covers the direct costs of producing what you sell such as raw materials, manufacturing labor, supplier costs, shipping to your warehouse.
COGS is subtracted from revenue to get gross profit. But, the contribution margin goes one step further. It shows how much profit you keep from each sale after all variable costs, making it easier to set prices and decide how much you can spend on marketing.
3. Gross Profit
Gross profit is the money left over after COGS. It shows how efficiently your core product or service generates income before overhead kicks in.
Strong gross profit doesn't guarantee a healthy business, but weak gross profit almost always signals problems upstream: pricing too low, supplier costs too high, or both.
4. Operating Expenses
Operating expenses are the costs of running the business that aren't tied directly to production. This includes rent, salaries, marketing, utilities, software, insurance, and depreciation.
Breaking these into subcategories (e.g., separating marketing spend from admin costs) makes it easier to identify where money is going and which areas to cut or invest in.
5. Operating Income
Operating income shows profitability from core business activities before interest and taxes. Comparing operating profit vs. gross profit tells you how much of your gross earnings are consumed by overhead.
6. Other Income and Expenses
Non-operating items sit outside your main business activity. Examples include interest earned on cash holdings, gains from selling equipment, interest paid on loans, or asset disposal losses.
These can meaningfully affect your bottom line, especially for businesses carrying significant debt.
7. Net Profit
Net profit is the final number, revenue minus every cost, including taxes. It's the definitive measure of whether your business is making money.
The formula is:
Net Profit = Operating Income + Other Income - Other Expenses - Taxes
The difference between operating profit vs. net profit reveals the impact of financing costs and taxes. A business can look profitable at the operating level and still post a net loss.
How to Prepare a YTD Profit and Loss Statement
You don't need to be an accountant to build a YTD P&L. Follow these nine steps.
Step 1. Gather All Financial Records
Pull every transaction from the start of your fiscal year to today. This includes your general ledger, bank statements, sales records, invoices, payroll reports, and expense receipts. Missing transactions will distort every downstream calculation.
Step 2. Calculate Total Revenue
Add up all income from product sales, services, and secondary sources like interest or rental income. Apply any returns, discounts, or allowances to arrive at net revenue.
Step 3. Determine Your COGS
Calculate the direct costs tied to what you've sold opening inventory plus purchases, minus ending inventory, plus direct labor.
Step 4. Calculate Gross Profit
Subtract COGS from net revenue to get this:
Gross Profit = Net Revenue - COGS
Step 5. List All Operating Expenses
Categorize and total every overhead cost for the YTD period: payroll, rent, utilities, marketing, software subscriptions, insurance, and depreciation. Keep categories consistent across reporting periods so comparisons are meaningful.
Step 6. Calculate Operating Income
Subtract total operating expenses from gross profit.
Operating Income = Gross Profit - Total Operating Expenses
Step 7. Add Non-Operating Items
Include any income or expenses outside normal operations. Interest income gets added. Interest expense on loans gets subtracted. Asset sale gains or losses go here too.
Step 8. Account for Income Taxes
Estimate or calculate the taxes owed on YTD profit. Use your effective tax rate as a starting point if exact figures aren't available yet.
Step 9. Arrive at Net Income
Now apply the final calculation.
Net Profit = Operating Income + Other Income - Other Expenses - Taxes
A positive number means profit. A negative number means your expenses have exceeded revenue for the year to date.

Download your Year-to-date P&L Statement Templates
A P&L statement template gives you a simple structure to track your revenue, costs, and profit in one place. It helps you organize your numbers clearly and understand how your business is performing over a specific period.
For ecommerce businesses, it also acts as a starting point. Once your data is structured, you can expand it into a YTD view to track performance over time and make better decisions.

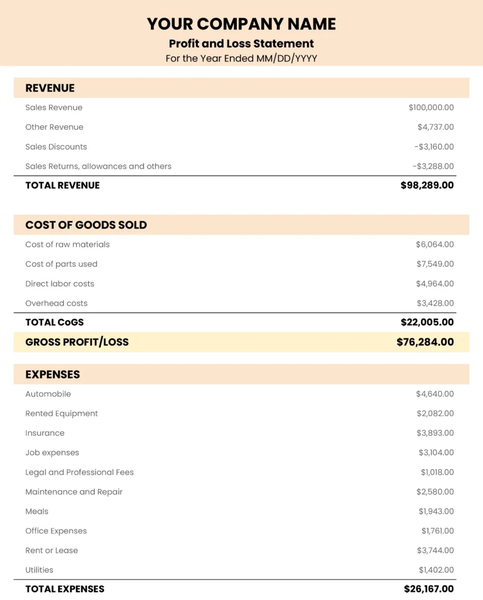
Year-to-date P&L statements template: Coefficient
How to Read and Interpret Your YTD P&L
Having the numbers is only part of the work. What really matters is how you read them and what decisions you take from them.
1. Analyze Revenue Trends
Start by comparing your current year-to-date revenue with the same period last year. This gives you a clear sense of direction. Steady year-over-year growth usually means the business is moving in the right direction. When revenue stays flat or starts to decline, it often points to issues with pricing, product mix, or customer acquisition.
2. Evaluate Profitability Margins
Margins show how efficiently your business turns revenue into profit. Three margins matter most, and each tells a different story.
- Gross profit margin: (Gross Profit / Revenue) x 100. Gross profit margin shows how much revenue remains after COGS. In ecommerce, this typically falls between 30% and 60%, depending on the category. When this margin drops, the cause is often rising supplier costs or pricing that has not kept pace.
- Operating profit margin: (Operating Income / Revenue) x 100. Operating profit margin looks at what remains after operating expenses. A decline here usually signals that expenses are growing too fast, or that marketing is not delivering strong returns.
- Net profit margin: (Net Income / Revenue) x 100. The all-in measure. For Shopify sellers, healthy net margins typically fall between 10% and 20%, but this can vary widely by niche and model. A healthy net margin shows that the business is not just generating revenue, but keeping a meaningful portion of it.
3. Identify Expense Patterns
Expenses should grow in line with revenue, not faster. When a cost category starts to outpace revenue growth, it deserves attention. For example, if marketing spend is up 40% while revenue only grows 12%, customer acquisition cost is likely increasing and returns are weakening.
It also helps to compare your cost structure with industry averages. If your COGS takes up 65% of revenue while competitors operate closer to 50%, there is a clear opportunity to improve margins. That gap usually points to sourcing, pricing, or operational inefficiencies.
4. Compare Against Multiple Benchmarks
A YTD P&L does not mean much on its own. Context makes the numbers useful. You should compare your results against your original budget, the same period last year, and typical benchmarks in your industry.
Each comparison answers a different question. The budget shows whether you are on track. Last year shows your growth. Industry benchmarks show how competitive your business is.
5. Judge Business Sustainability
At the end of the day, your YTD P&L should answer a simple question: is this business model working?
Consistent net income and stable margins usually mean the model is sound. On the other hand, ongoing losses or shrinking margins suggest something needs to change. Pricing, costs, or both may need adjustment.
YTD P&L vs. Other Financial Statements
1. YTD P&L vs. Monthly and Quarterly P&L
Report | Time Span | Best For |
|---|---|---|
Monthly P&L | Single month | Short-term cost monitoring |
Quarterly P&L | Three months | Investor reporting, board reviews |
YTD P&L | Fiscal year to date | Progress tracking, annual goal comparison |
A monthly P&L helps you catch short-term changes or one-off issues. A quarterly P&L gives a broader view that is often used for external reporting. The YTD P&L sits in between. It shows how your business is performing over time and helps you track whether you are moving toward your annual targets.
2. YTD P&L vs. Annual P&L
The annual P&L covers a complete 12-month fiscal year. The YTD P&L is essentially the same report, just not finished yet. If you generate a YTD P&L on the last day of your fiscal year, it will match your annual P&L exactly.
3. P&L vs. Balance Sheet
A profit and loss vs. balance sheet comparison clarifies two things: the P&L measures performance over time (revenues and expenses), while the balance sheet captures a snapshot of financial position at a single moment (assets, liabilities, and equity). Both are essential. One shows how you performed, the other shows where you stand.
4. P&L vs. Cash Flow Statement
This difference matters in practice. A business can report strong net income on its P&L but still run into cash problems if payments from customers are delayed. Looking at both reports together gives a more complete picture of financial health.
Final Thoughts
A year-to-date profit and loss statement is more than a running total. It is a real-time control panel for your business. It shows whether your revenue is growing, whether your costs are under control, and whether your profit is actually improving as the year progresses. When used consistently, it helps you catch issues early, adjust faster, and stay aligned with your financial goals instead of waiting until year-end to react.
But like any report, its value depends on visibility and accuracy. If your numbers are delayed, incomplete, or scattered across tools, your decisions will be too.
For Shopify sellers, that is where TrueProfit stands out as the #1 real-time net profit analytics platform. It brings your revenue, COGS, fees, and ad spend into one real-time dashboard, so you always know your true net profit and can make decisions based on what your business actually keeps.

Harry Chu is the Founder of TrueProfit, a net profit tracking solution designed to help Shopify merchants gain real-time insights into their actual profits. With 11+ years of experience in eCommerce and technology, his expertise in profit analytics, cost tracking, and data-driven decision-making has made him a trusted voice for thousands of Shopify merchants.