Profit and Loss Statement for Small Business: A Complete Guide + Free Template
Table of Contents
A profit and loss statement (P&L) is the financial report that tells you whether the business is profitable and where money is being lost. It summarizes revenues, costs, and expenses over a set period to show one number: net profit or net loss.
In this article, you’ll learn how to read a P&L statement, what each section actually means, and how to use it to spot issues early, control costs, and make better decisions with your numbers.
In this blog:
What Is a Profit and Loss Statement?
A P&L statement, also called an income statement or statement of financial performance, shows how much money your business made and spent over a specific period, and what's left after all costs are paid. The top line is revenue. The bottom line is net profit.
If you want a deeper look at what a P&L actually represents and how it differs from an income statement, those breakdowns are worth reviewing first.


How the P&L Differs from Other Financial Statements
The P&L is one of three core financial reports. Each answers a different question.
- P&L: Are you profitable over time?
- Balance sheet: What do you own and owe right now?
- Cash flow: How is cash actually moving?
Statement | What It Shows | Time Frame |
|---|---|---|
Profit & Loss | Revenue, expenses, and net profit/loss | Over a period |
Balance Sheet | Assets, liabilities, and owner's equity | At a single point in time |
Cash Flow Statement | Actual cash moving in and out | Over a period |
The most common confusion between the P&L and the balance sheet is: The P&L measures performance over time; the balance sheet captures financial position at a single moment.
The other common mix-up is profit vs. cash flow. A business can show a profit on its P&L and still run out of cash, especially when revenue is recognized before payment is received.
Key Components of a P&L Statement for Small business
Every P&L follows the same top-to-bottom structure. Each line strips away another layer of cost until you reach net income.
1. Revenue
Revenue is total income from selling products or services. Gross revenue is the raw total before deductions. Net revenue subtracts returns, allowances, and discounts.
The formula is:
Gross Sales - (Returns + Allowances + Discounts) = Net Revenue
2. Cost of Goods Sold (COGS)
COGS is what it actually costs you to deliver the product or service you are selling.
- For retail, it is the cost of buying inventory that you plan to resell
- For manufacturing, it includes raw materials, direct labor, and other production costs
- For service businesses, it is usually the wages or contractor fees tied directly to the work
Costs like rent, marketing, and admin salaries are not part of COGS. Those are operating expenses. Mixing them up is a common mistake and can throw off your P&L.
3. Gross Profit
Gross profit is what remains after subtracting COGS from net revenue. It measures how efficiently you produce and sell before overhead.
The formula is:
Net Revenue - COGS = Gross Profit
For example, a bakery with $75,000 in net sales and $35,000 in COGS earns $40,000 in gross profit. That $40,000 must then cover all operating costs.
For how gross profit compares to what actually ends up in your pocket, see gross profit vs. net profit.
4. Operating Expenses
Operating expenses are the costs of running your business regardless of sales. These typically include things like rent, utilities, marketing, admin salaries, insurance, and legal fees.
Depreciation and amortization also fall into this category. Even though they don’t involve actual cash leaving your account, they still reduce your taxable income.
5. Operating Income (EBIT)
Operating income shows how much your business actually earns before interest and taxes are taken into account. It focuses only on day-to-day operations, without mixing in financing decisions.
The formula is:
Operating Income = Gross Profit - Operating Expenses
This number helps you understand whether your business model itself is profitable, regardless of how the business is funded.
See operating profit vs. net income for why both figures tell different stories.
6. Non-Operating Items and Taxes
After operating income, you need to account for items that sit outside your primary business. These include:
- Interest income from cash or investments;
- Interest expenses from loans or credit lines;
- Any gains or losses from selling assets like equipment or property (not inventory).
Then comes income tax expense, which covers the taxes your business owes at the federal, state, and local levels for that period.
7. Net Profit
Net income is the final number on your P&L. It shows what is left after all costs have been accounted for.
The formula is:
Operating Income +/- Non-Operating Items - Taxes = Net Income
If the number is positive, the business makes a profit. If it is negative, the business runs at a loss. This is why it is important to look beyond gross profit. Understanding how gross profit and net income differ matters because a business can look healthy at the gross level and still lose money once overhead and taxes are factored in.
P&L Statement Example for Small Business
Below is a real-format P&L for "Artisan Bake Shop," a hypothetical retail bakery, for Q1 2026.
Artisan Bake Shop: P&L Statement | Current Quarter | Previous Quarter |
|---|---|---|
Net Revenue | $75,000 | $70,000 |
Cost of Goods Sold | ||
Ingredients & Supplies | $20,000 | $18,000 |
Direct Labor (Bakers) | $15,000 | $14,000 |
Total COGS | $35,000 | $32,000 |
Gross Profit | $40,000 | $38,000 |
Operating Expenses | ||
Rent | $4,500 | $4,500 |
Utilities | $1,000 | $900 |
Marketing & Advertising | $2,000 | $1,500 |
Administrative Salaries | $7,000 | $7,000 |
Insurance | $500 | $500 |
Depreciation | $300 | $300 |
Total Operating Expenses | $15,300 | $14,700 |
Operating Income | $24,700 | $23,300 |
Interest Expense | ($200) | ($200) |
Earnings Before Tax | $24,500 | $23,100 |
Income Tax Expense | $4,900 | $4,620 |
Net Income | $19,600 | $18,480 |
What the Numbers Show
Net sales hit $75,000. After $35,000 in COGS, gross profit was $40,000, a gross margin of 53.3%. Operating expenses of $15,300 left $24,700 in operating income.
After interest and taxes, net income was $19,600. That's a 6% improvement over the prior quarter's $18,480, driven by higher sales without a proportional rise in costs. That's what healthy margin expansion looks like.

How to Prepare a P&L Statement: Step by Step
Building a P&L is straightforward when approached in order. Consistent data collection before any calculations is what makes the P&L accurate.
Step 1. Choose Your Reporting Period
Firstly, you should pick a consistent timeframe: monthly, quarterly, or annually. Monthly catches problems early. Quarterly and annual work better for investor reporting and tax prep. Whatever you choose, stick to it.
Step 2. Gather Your Financial Data
Once the timeframe is set, the next step is to gather all financial data for that period.
You will need bank statements from all business accounts, along with sales records such as invoices, POS data, or exports from your eCommerce platform. In addition, make sure to include supplier invoices, rent, utilities, and payroll records, including employer taxes.
It is important to double-check that nothing is missing. Even small gaps in data can lead to incorrect calculations later on.
Step 3. Calculate Net Revenue, COGS, and Gross Profit
After organizing your data, you can start building the top part of the P&L.
- Begin with your total sales for the period. From that number, subtract any returns and discounts to arrive at net revenue.
- Next, calculate your Cost of Goods Sold (COGS). These are the direct costs tied to the products or services you sold, such as materials or production costs.
- Once you have both numbers, subtract COGS from net revenue. The result is gross profit, which shows how much remains after covering direct costs.
Net Revenue - COGS = Gross Profit.
Step 4. Calculate Operating and Net Profit
In the final step, you account for all remaining business expenses to find your bottom line.
- First, add up your operating expenses. These are indirect costs like marketing, salaries, software, and rent.
- Next, subtract these expenses from your gross profit to get your operating income: Gross Profit - Operating Expenses = Operating Income.
- After that, adjust for interest, any gains or losses, and taxes. The result is your net profit, which shows how much profit the business actually made during the period.
P&L Statement Templates for Small Businesses
Templates are the fastest way to start tracking your finances without building a system from scratch. Our template is designed to be flexible, so you can adjust it based on how your business operates. Here are a few ways you can tailor it for different needs.
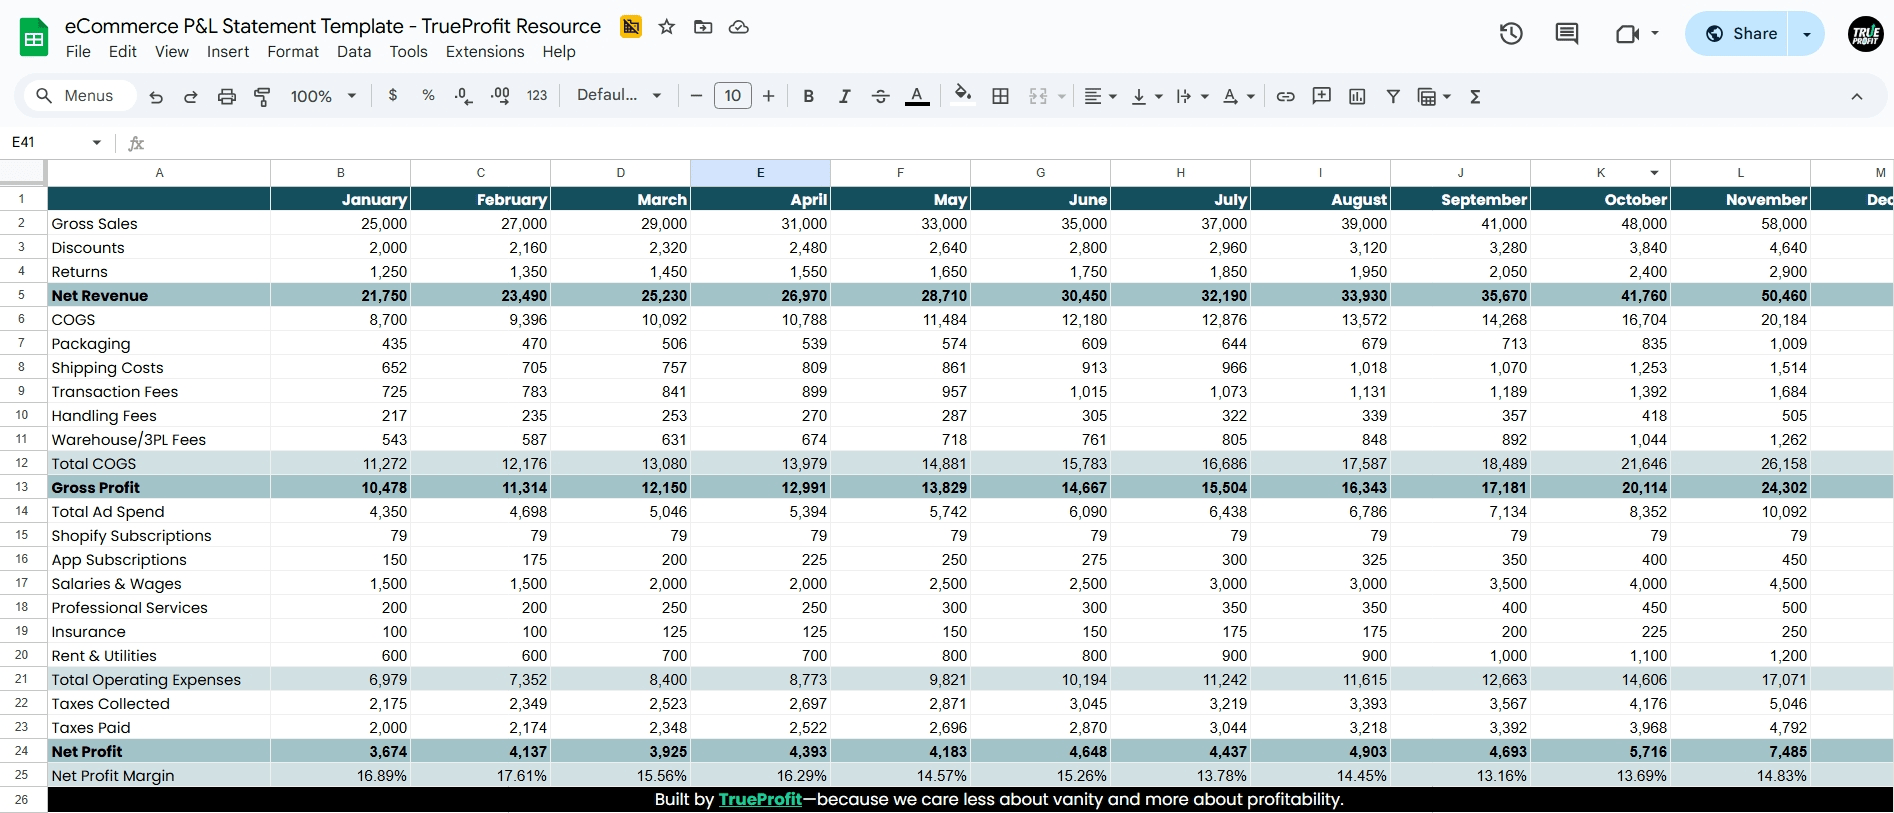
Monthly P&L Statement
Reviewing your profit and loss every month helps you stay close to your numbers. It creates a steady routine for monitoring performance, spotting trends early, and comparing how your store evolves over months.
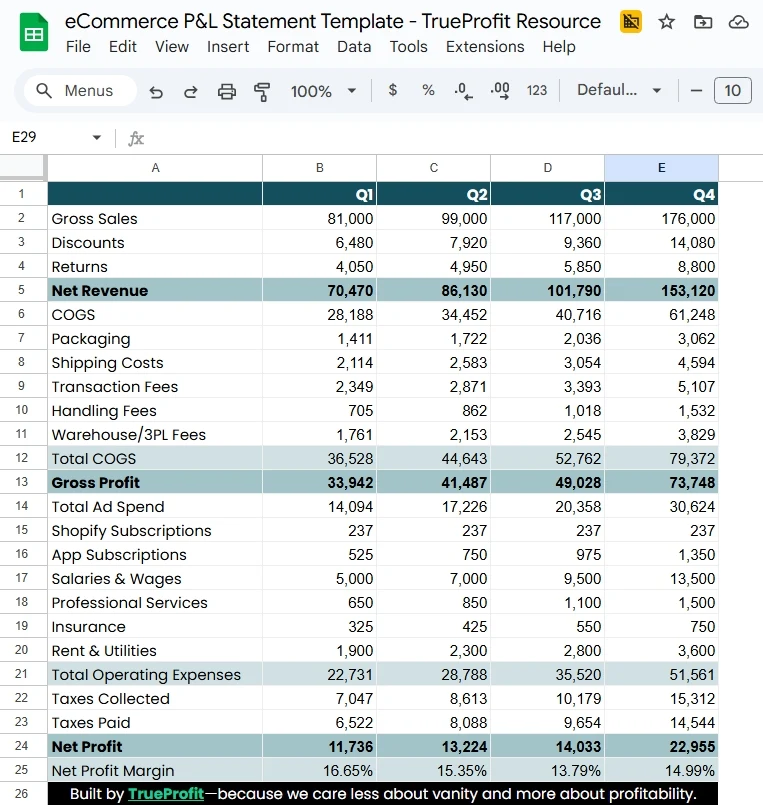
Quarterly P&L Statement
While monthly tracking helps you stay close to the numbers, looking at your profit and loss quarterly gives you a bigger-picture view. It’s perfect for reviewing long-term trends, assessing strategy, and making decisions with less noise from short-term fluctuations.
How to Read and Analyze Your P&L
Generating a P&L is step one. Reading it correctly is where it pays off.
1. Read Top-Down, Then Diagnose
Start from revenue and work your way down line by line. Each level tells you something different.
- If your gross profit looks thin, the problem usually comes from pricing or high COGS.
- If your gross profit is healthy but operating income is low, it often means your overhead is too high and is cutting into your margins.
- If operating income looks fine but net income is still low, then the issue is likely outside core operations, such as high interest expenses or taxes.
Reading your P&L this way helps you quickly narrow down where the problem is, instead of guessing.
2. Track Three Core Margins Every Period
Metric | Formula | What It Tells You |
|---|---|---|
Gross Profit / Revenue × 100 | Production and pricing efficiency | |
Operating Income / Revenue × 100 | How well you manage total overhead | |
Net Profit Margin | Net Income / Revenue × 100 | True bottom-line profitability |
Industry benchmarks vary widely. E-commerce businesses often target a net margin of 15–25%. Service businesses can run higher. Retail margins are frequently in the 2–10% range. Knowing your benchmark helps you evaluate whether your margins are competitive.
3. Compare Periods, Not Snapshots
A single P&L period tells you very little on its own. Comparing month over month or year over year shows whether margins are expanding or compressing, whether revenue growth is translating into profit growth, and which expense lines are creeping up.
See revenue growth vs. profit growth for why top-line growth without margin discipline can actually hurt you.
4. Break Down Expense Lines
Don't just look at total operating expenses. Break them down.
If marketing spend doubled but revenue didn't respond, that's a problem. If utilities jumped 30%, investigate why. The P&L gives you the signal; it's your job to investigate the cause.
5. Use Contribution Margin for Product-Level Insight
If you sell multiple products or services, a P&L alone won't tell you which ones are most profitable. Use contribution margin analysis alongside your P&L to identify which revenue streams actually drive profit and which ones dilute it.
Common P&L Mistakes That Can Hurt Your Profits
1. Mixing Up COGS and Operating Expenses
When rent or admin salaries get classified as COGS, gross profit looks artificially low. That makes your pricing seem unprofitable when it isn't, and can lead to unnecessary price increases or supplier renegotiations chasing the wrong problem.
If a cost exists regardless of whether you made a single sale, it's an operating expense, not COGS.
2. Missing Transactions
Every unrecorded sale or expense corrupts your numbers. Small cash purchases, refunds processed outside your main system, or forgotten subscriptions all add up. Reconcile your P&L against your bank statements every period.
3. Switching Accounting Methods
Cash basis records revenue when cash arrives; accrual records it when earned. Both are valid. Switching between them period to period makes your P&L incomparable over time. Most growing businesses use accrual accounting because it gives a more accurate picture of actual performance.
4. Reporting Annually Instead of Monthly
Annual-only P&Ls mean 12 months of drift before you spot a problem. Monthly reporting gives you time to act.
5. Generating Without Reviewing
A P&L you never read is a wasted hour. Schedule time each period to compare margins, review expense trends, and ask what changed and why.
6. Not Reconciling with Your Balance Sheet
Your net income from the P&L flows directly into the equity section of your balance sheet. If these don't reconcile, there's an error somewhere in your books.
Final Thoughts
A profit and loss statement is more than just a financial report. It’s the clearest way to understand whether small businesses like yours are actually making money and where that money is going.
When you break it down properly, each layer of the P&L tells a different story. Revenue shows growth, gross profit reveals product efficiency, and net profit tells you what your business truly keeps. The value comes from not just generating the report, but consistently reviewing it, comparing periods, and using it to guide decisions.
But in practice, building and maintaining an accurate P&L isn’t always simple. Data is scattered across platforms, costs are easy to miss, and manual tracking takes time.
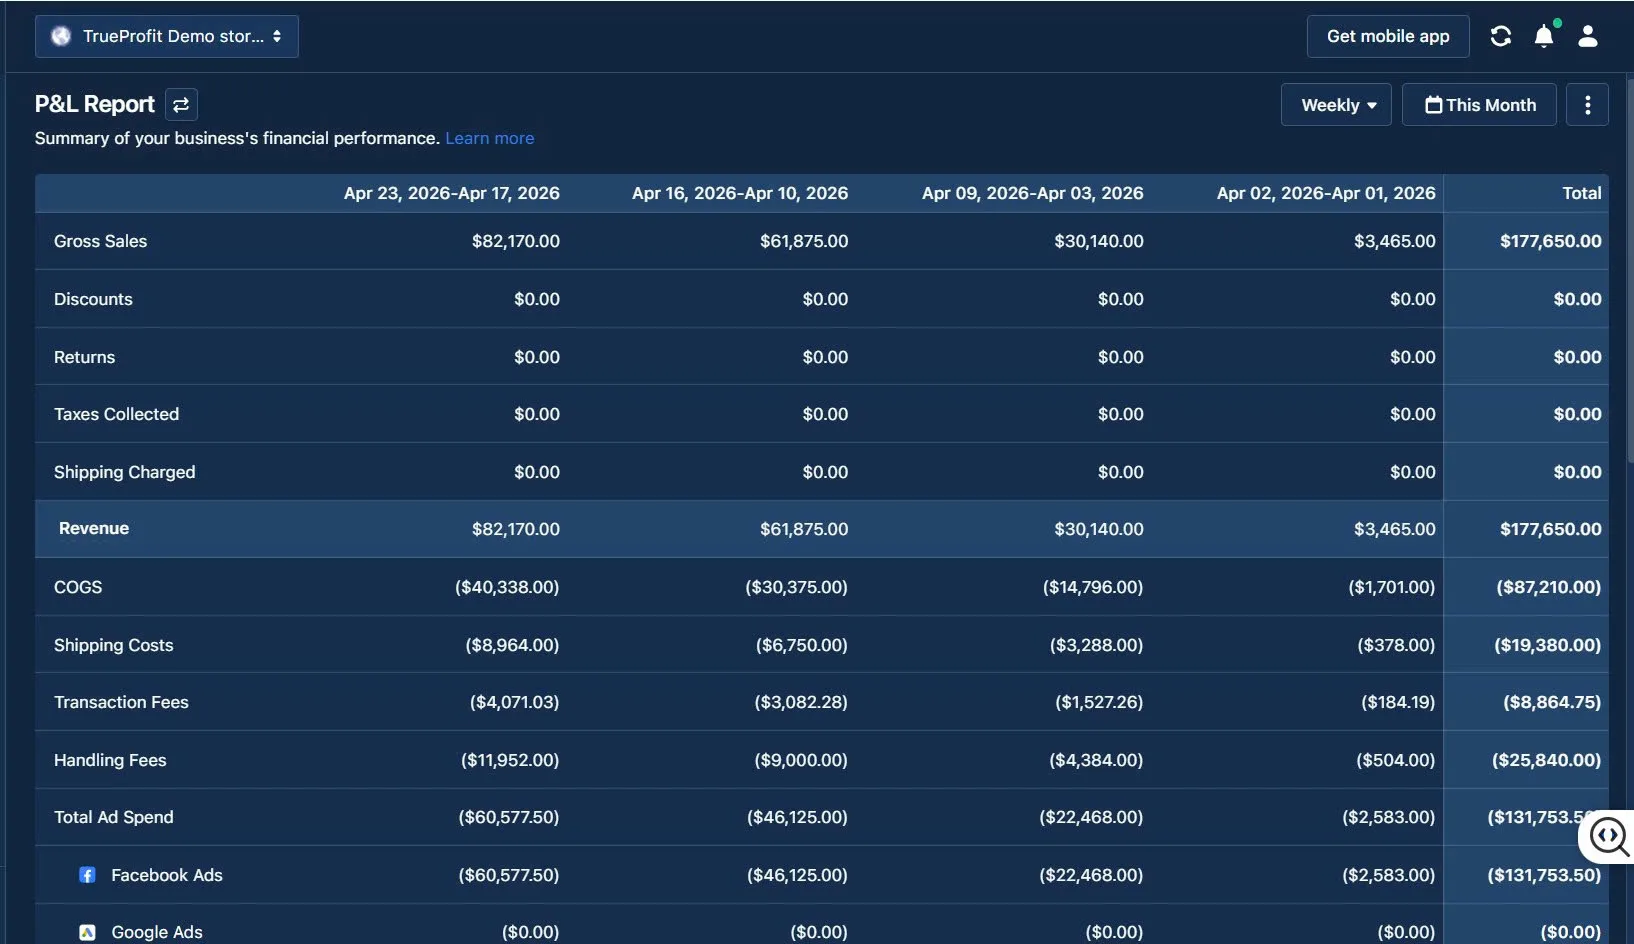
That’s where tools like TrueProfit come in. Instead of piecing everything together yourself, it automatically tracks your revenue, costs, fees, and ad spend in one place, giving you a real-time view of your net profit. So you’re not just looking at numbers, but actually understanding how your business performs day to day.


Lila Le is the Marketing Manager at TrueProfit, with a deep understanding of the Shopify ecosystem and a proven track record in dropshipping. She combines hands-on selling experience with marketing expertise to help Shopify merchants scale smarter—through clear positioning, profit-first strategies, and high-converting campaigns.