Table of Contents
Profitability ratios are financial metrics used to assess a business’s ability to generate profit from its revenue.
These ratios are a cornerstone of profitability analysis—used by investors, analysts, and internal decision-makers to evaluate financial health, benchmark performance against competitors, and spot trends over time.
They’re typically grouped into margin ratios and return ratios—and together, they paint a full picture of your business performance.
In this guide, we’ll walk you through key ratios, what they mean, and formulas on calculating them. Let’s dive in.
In this blog:
What are Profitability Ratios?
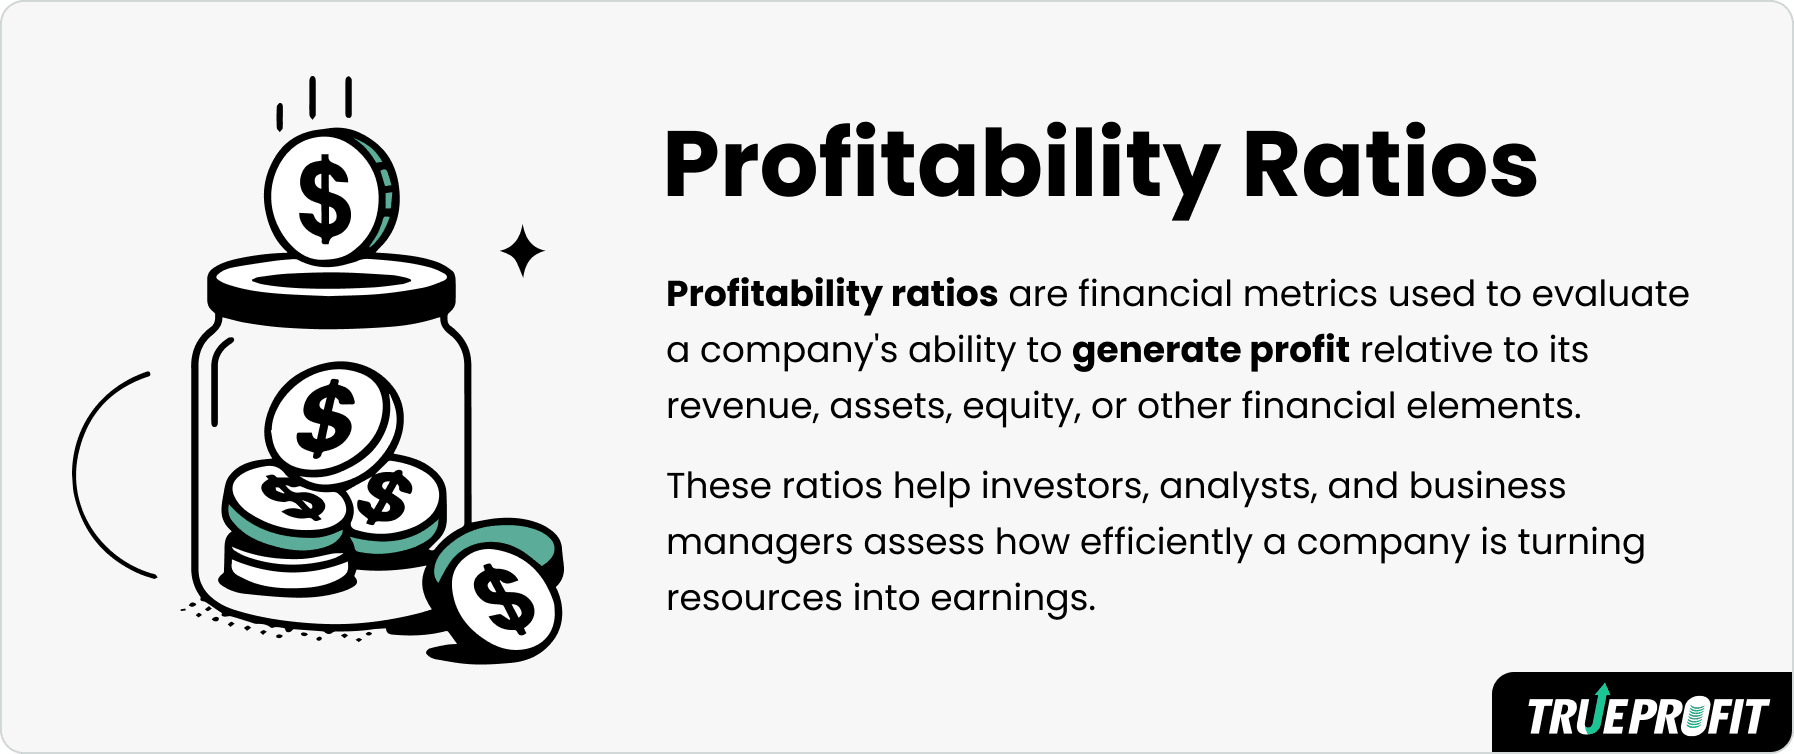
Profitability ratios are financial metrics used to assess a business’s ability to generate profit from its revenue. Instead of focusing solely on how much money a business brings in, these ratios zero in on what’s left after all the costs—materials, labor, operating expenses, interest, and taxes have been paid.

What is the Purpose of Profitability Ratios?
Profitability ratios are used to evaluate a business’s ability to generate profit over time in relation to its revenue, costs, assets, or equity. These ratios are a cornerstone of profitability analysis used by investors, analysts, and internal decision-makers to evaluate financial health, benchmark performance against competitors, and spot trends over time.
By comparing profits to different parts of the business (like sales, total assets, or equity), profitability ratios give a clearer picture of where a company is strong or where it might be underperforming.
What are the Types of Profitability Ratios?
Profitability ratios fall into two main categories: margin ratios and return ratios.
Margin ratios measure how much profit your business keeps from its revenue. It shows the percentage of your revenue is left after deducting specific types of expenses—whether that’s the cost of goods sold (COGS), operating costs, or all expenses combined.
The three core margin ratios include:
- Gross profit margin
- Operating profit margin
- Net profit margin
Return ratios evaluate how effectively a company uses its assets or equity to generate profit. It shows the relationship between net income (or net profit) and the resources used to produce it, such as:
- Total assets
- Shareholders’ equity
- Invested capital
How to Calculate Profitability Ratios?
Let’s break down the formulas for both margin and return ratios.
Margin Ratios Formula
Gross profit margin is a business performance metric that measures the percentage of revenue that exceeds the cost of goods sold (COGS). It’s a core health indicator for product profitability analysis. To calculate it using this formula:
Operating profit margin is a profitability ratio that shows what percentage of revenue remains after paying for core operating expenses—but before interest and taxes. It’s often used to evaluate how well a company controls its core costs and how scalable its operations are.
The formula is:
Net profit margin is the percentage of revenue left after all business expenses are deducted. That includes COGS and operating expenses, interest, taxes, and any one-time charges. It’s considered the most comprehensive indicator of overall profitability because it reflects everything that impacts your bottom line.
It is calculated as:
Return Ratios Formula
Return on Assets (ROA) measures how efficiently a business uses its total assets to generate net income. ROA is calculated by dividing net income by total assets.
Return on Equity (ROE) measures a company’s ability to generate profit using shareholders’ capital. It's the percentage of profit earned for each dollar of equity held by shareholders.
The formula for ROE is:
Finally, Return on Invested Capital (ROIC) compares operating profit (after tax) to all the money invested in the business, giving a clear picture of how well the business is performing.
The formula is:

What are Good Profitability Ratios for Business?
Here’s a breakdown of what’s considered “good” profitability:
- A good gross margin typically falls between 60% and 70%, depending on the type of business.
- A good operating margin usually ranges from 15% to 20%, though this varies.
- A healthy net margin is often 10% to 20%, though for some sectors like retail or food & beverage, even 5% is acceptable.
- A ROA of 5% or more is typically considered good.
- Investors usually look for ROE in the 15%–20% range or higher.
- A ROIC above 10% is a strong sign, especially if it consistently exceeds the company’s cost of capital.
As a rule of thumb: The higher, the better. But context is everything. A “good” profitability ratio isn’t just about hitting a number—it’s about being profitable in a way that fits your business model and supports your long-term growth.
What are Limitations of Profitability Ratios
However, these ratios have significant limitations because they don’t reveal the causes behind profitability trends.
A high net profit margin, for instance, might suggest strong performance—but it won’t tell you whether the improvement came from increased sales, cost-cutting, or a one-time event like selling an asset. On the flip side, a drop in profitability could result from rising raw material costs, declining sales, or inefficiencies in operations—but the ratio alone won’t clarify which.
Understanding profitability ratios is a great first step—but applying them consistently is what drives real growth.
If you’re a Shopify seller, TrueProfit can make this process effortless. It automatically tracks your net profit, real-time margins, and key financial ratios—even as your COGS, ad spend, or shipping fees fluctuate. So instead of guessing where your business stands, you’ll always have a clear, up-to-date picture of your performance.


Harry Chu is the Founder of TrueProfit, a net profit tracking solution designed to help Shopify merchants gain real-time insights into their actual profits. With 11+ years of experience in eCommerce and technology, his expertise in profit analytics, cost tracking, and data-driven decision-making has made him a trusted voice for thousands of Shopify merchants.