What’s a Good ROAS in 2025? (Benchmarks + Pro Tips)
What counts as a “good” ROAS can vary a lot depending on market niche, ad platform, and cost structure.
In this guide, we’ll break down what a good ROAS really looks like, the average benchmarks across ecommerce niches, and strategies to boost yours.
In this blog:
What is ROAS?
ROAS (Return on Ad Spend) is a common KPI metric used for measuring ad performance. It helps track advertising ability to generate revenue from each dollar spent on ads.
Formula:
For example, if you spend $1,000 on ads and this investment generates $3,000 in sales, then the ROAS is 3.0 (or 3:1). That means you earn $3 for every $1 spent.
In ecommerce, ROAS is used heavily to measure performance across platforms like Meta Ads (Facebook, Instagram) and Google Ads.
What is a Good ROAS?
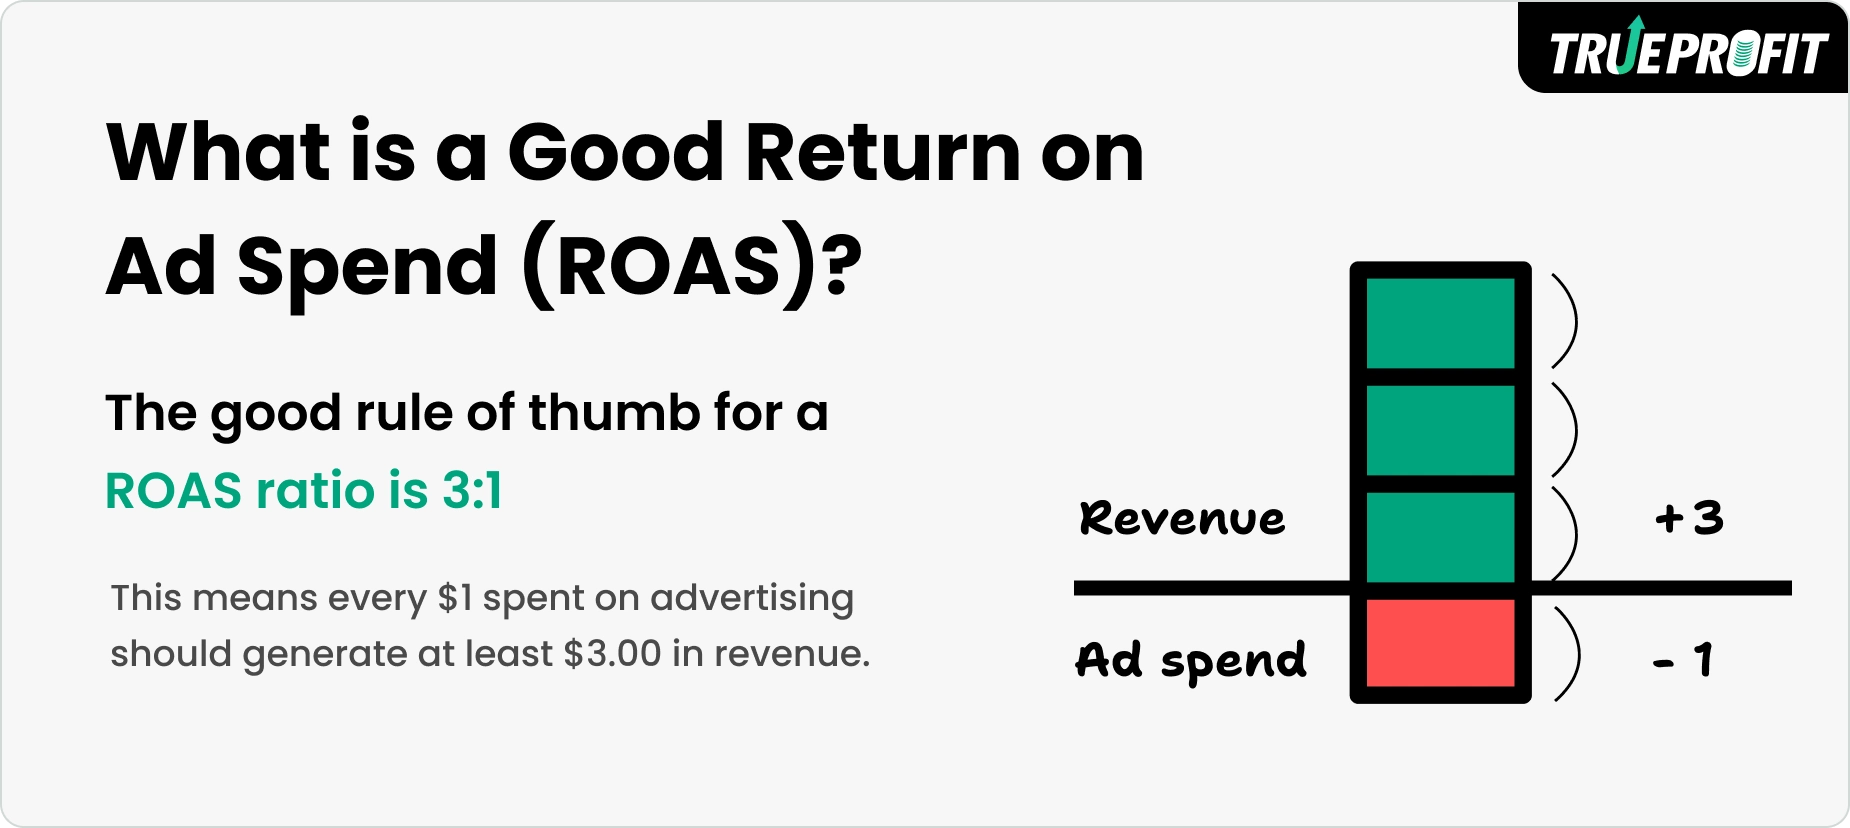
According to Harry Chu, Founder of TrueProfit, the most common “rule of thumb” says a ROAS of 3:1 is good for most ecommerce businesses. This means for every dollar spent on advertising, advertisers should make at least $3 back in revenue.
Out of that $3 in revenue, a significant portion goes to cost of goods sold (COGS), shipping fees, payment charge, and other operating expenses. After covering these, what’s left is net profit—the bottom line of the store finance.
That said, the “ideal” ROAS still depends on your margins, niche, and growth stage. High-profit margin businesses might thrive with lower ROAS, while low-margin stores often need higher than 3.0 just to break even.
The Average ROAS By Niches
ROAS doesn’t look the same across every ecommerce niche as every product category comes with its own COGS (Cost of Goods Sold), net profit margin, and customer buying behavior.
Here’s a look at the average ROAS benchmarks by niche in 2025:
- Apparel & Fashion: ~4.3
- Art & Collectibles: ~5.1
- Baby Products: ~3.9
- Beauty & Cosmetics: ~3.6
- Books & Publishing: ~4.2
- Consumer Electronics: ~3.8
- Jewelry & Accessories: ~4.0
- Food & Beverages: ~3.4
- Healthcare & Supplements: ~2.3
- Home & Garden: ~3.8 – 4.0
- Pet Supplies: ~1.8
- Sporting & Fitness Goods: ~4.3
- Toys & Games: ~6.0
Niches with higher margins often see the highest ROAS—like art, jewelry, or toys, while essentials and high-competition categories—like healthcare or pet supplies—often see lower averages.
What is a Good ROAS for Meta Ads?
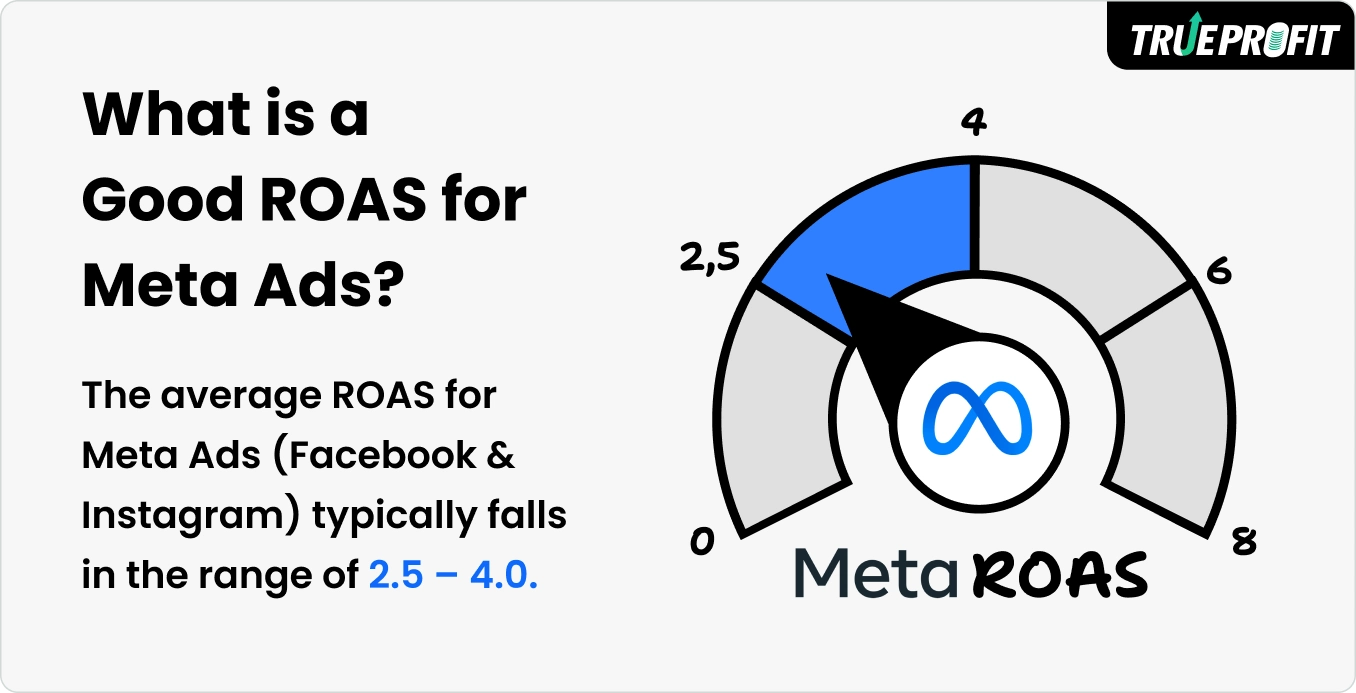
The average ROAS for Meta Ads (Facebook & Instagram) typically falls in the range of 2.5 – 4.0. This means that every $1 spent on advertising can generate between $2.50 and $4.00 back in revenue.
For impulse-purchase niches such as apparel, beauty, and lifestyle products, hitting a 3.0+ ROAS is generally considered strong performance.
For higher-ticket items—like furniture, electronics, or fitness equipment—the ROAS benchmark is usually lower, around 1.8 – 2.5.
Top performers pushing above 4.0, often through strong creatives, optimized targeting, and effective retargeting campaigns.
What is a Good ROAS for Google Ads?
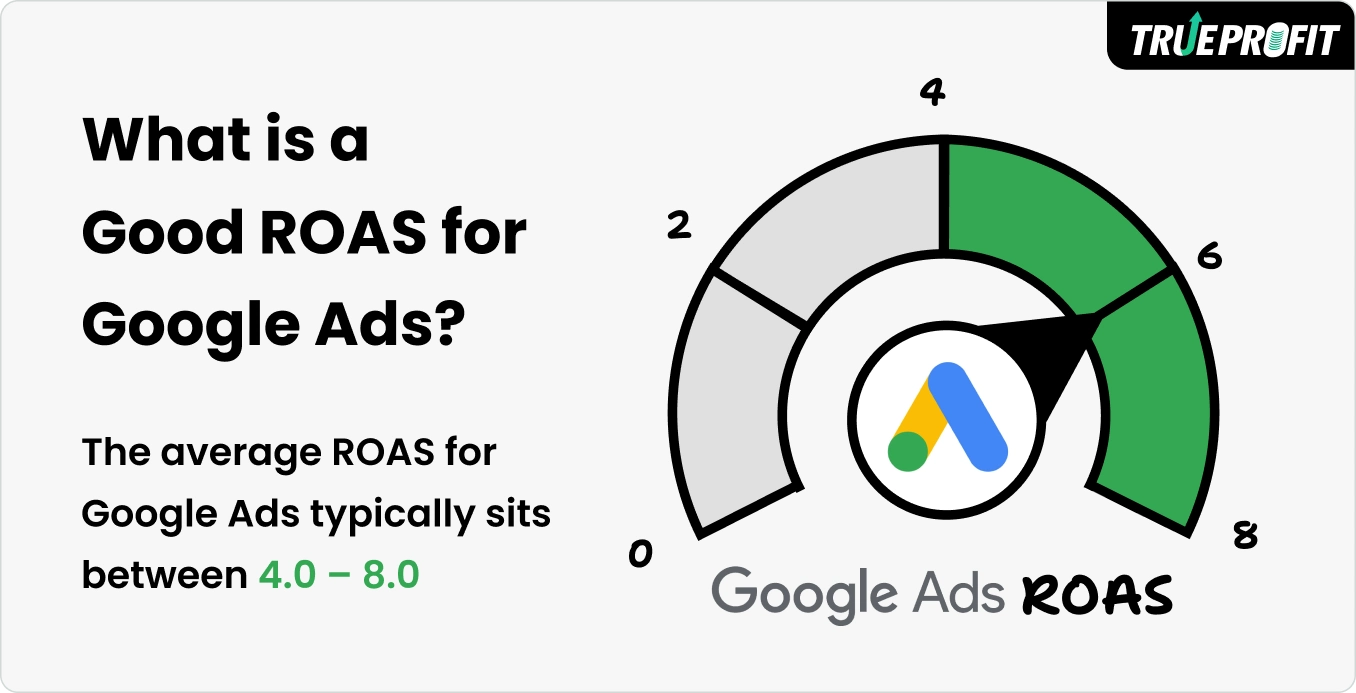
The average Google Ads ROAS sits between 4.0 – 8.0, meaning that for every $1 spent, advertisers typically earn $4 to $8 in return. This is significantly stronger than the 2.5 – 4.0 average on Meta Ads due to higher-intent driven behavior on this platform. Users on Google are actively searching for products or solutions, while Meta users are browsing and may purchase impulsively.
Performance varies across Google’s different ad placements such as Search Ads, Shopping Ads, Display Network Ads, and YouTube Ads. Out of those positions, Search Ads have the strongest ROAS at 6.0 – 8.0, while the lowest belongs to YouTube Ads at 2.0 – 3.5 range.
Search Ads (Top of Results): ~ 6.0 – 8.0. These ads capture users with the highest purchase intent— most likely to convert immediately.
Shopping Ads (Product Listings): ~ 5.0 – 6.5. The product image, price, and brand appear right in search results, making it easy for customers to click and buy.
Display Network Ads: ~ 2.5 – 4.0. Best for retargeting ads or building top-of-funnel awareness.
YouTube Ads: ~ 2.0 – 3.5. Best for brand awareness.
What is a Good ROAS for TikTok Ads?
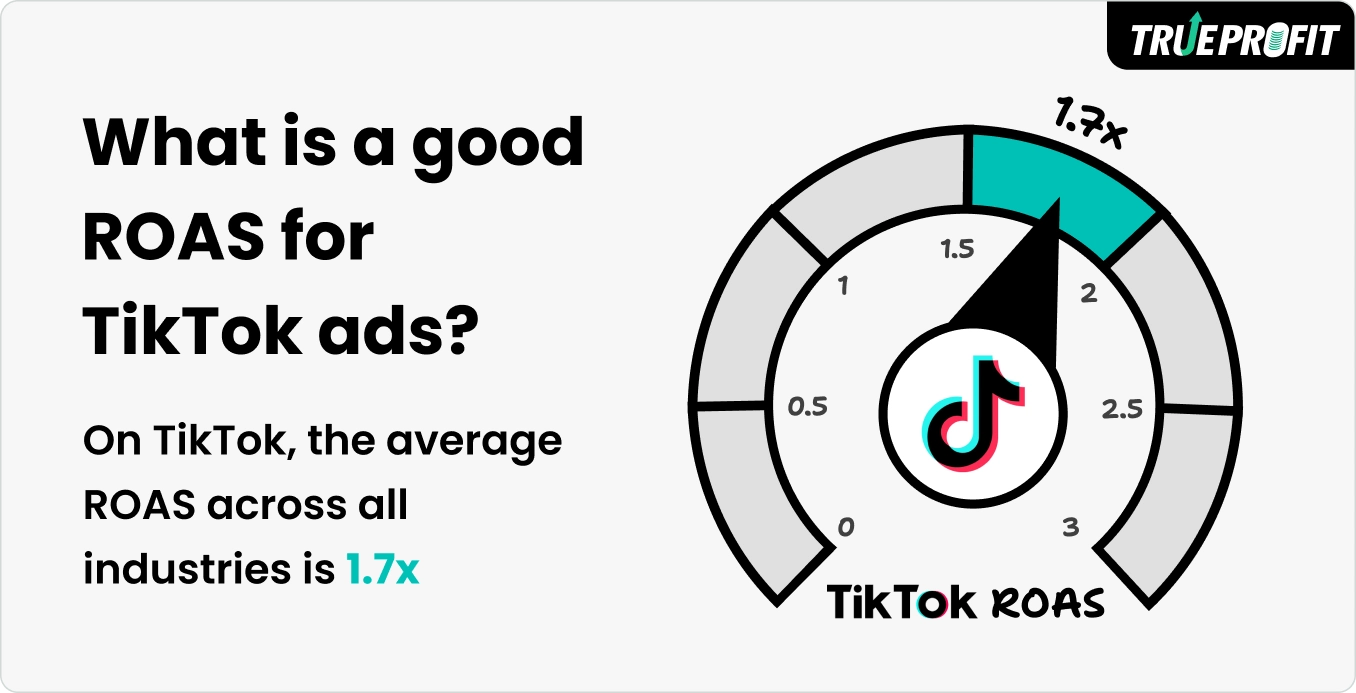
A good Return on Ad Spend (ROAS) depends on the industry you’re in. On TikTok, the average ROAS across all industries is 1.7x, meaning every $1 spent typically brings in $1.70 in revenue.
Some industries stand out as top performers. Beauty and Personal Care leads with a 3.5x ROAS, making it one of the strongest categories on the platform. Apparel and Accessories follows with 2.8x, while Entertainment and Media averages around 2.5x. These niches benefit from TikTok’s visual storytelling and highly engaged user base.
Why is Good ROAS Important?
ROAS is one of the most common KPIs for measuring digital ad effectiveness, helping evaluate ad campaign performance based on its impact on revenue. By understanding ROAS, advertisers can spot high-converting campaigns while adjusting the profit-leaker, making much better decisions on optimizing and scaling ads.
In short, the good ROAS ratio is often the indicator of overall good campaign performance and can be the early sign of campaign profitability.
We call it an early sign because, as Harry Chu, Founder of TrueProfit, highlights, the more accurate metric to track is Net Profit on Ad Spend (NPOS), since it factors in all costs beyond just ad spend.
Return on Ad Spend vs. Net Profit on Ad Spend: What’s the Difference?
Return on ad spend (ROAS) and Net profit on ad spend (NPOAS) might sound similar, but they measure two very different things.
ROAS (Return on Ad Spend) is a revenue-focused metric that doesn’t factor in costs like COGS, shipping, discounts, or platform fees. Because of that, a campaign can show a “good” ROAS while still leaving you with little or even negative profit if the margins are thin.
NPOAS (Net Profit on Ad Spend) is a profit-focused metric that shows the net profit you earn for every dollar spent on advertising. It reflects the true profitability of your ad campaigns after all costs are considered, making a much more reliable indicator of whether your ads are truly helping your business grow.
Key Factors That Determine a Good ROAS
A little change in these 4 key factors over the long run can affect the ROAS performance.
Profit margin (net profit margin). A change in net profit margin is immediately reflected in ROAS because both metrics are directly tied to revenue and costs. When net margin shrinks—say from rising COGS or fulfillment costs—advertisers often need a higher ROAS to stay profitable. Profit margin is the profit as percentage after calculating all costs from the total sales. It is used for measuring business ability to generate profit within a given period.
Average order value (AOV) is the average amount a customer spends per transaction. In the context of more revenue per conversion while ad spend stays the same, a higher AOV can dramatically improve ROAS.
Customer lifetime value (CLV) is the total revenue a business can expect from one customer throughout their relationship with the brand. Low CLV (as in one-time purchase products) means ROAS must be high to cover acquisition cost, making profit right on the first order. High CLV (as in repeat purchase product) can pair with lower first-purchase ROAS.
Ad platforms—like Meta Ads, Google Ads, or TikTok Ads—all attract different types of buyers and types of intent. Take the example of Google Ads & Meta Ad mentioned above. Users on Google are more likely to have purchase intent, while they’re on Meta only for browsing and entertainment. This makes ROAS in Google ads tend to outperform Meta Ads.
5 Best Practices to Boosting ROAS
Here are proven strategies to lift ROAS—each one can tie back to supported KPIs like net profit margin, CLV, AOV, net profit.
Maximize Net Profit Margin per Every Sale
This means advertisers earn more profit from every order they close. A good profit margin for retail falls between 2–10%. Many stores run on thin margins (5–10%), but reaching above 15% puts you in a strong position to scale ads confidently.
Step 1: Ask suppliers for bulk discounts, seasonal promos, or better payment terms. Even shaving 5% off your COGS has a compounding effect across every sale.
Step 2: Audit product catalog and tag which items generate the highest margins. Then reallocate the budget ads to push these products harder.
Step 3: Test price increases in small increments while adding value. A healthy markup ratio is often 2x to 3x the cost of goods sold (COGS), but this can vary depending on the product category and competition.
Strategic Upsells and Bundles
The idea is to recommend higher-value purchases that feel relevant and price-make-sense to customers. Package 2–3 related products together at a slightly reduced per-item cost, or mark up an item price within 20–30% of the original item. Then show upsells/bundles on product pages, in carts, or even post-purchase emails. Each stage can drive extra revenue differently.
Improve Ad Creatives
The biggest creative components that influence performance are:
- Headline & Copy: Clear, benefit-driven, and emotionally resonant messaging.
- Visuals: Product-focused, lifestyle-driven, or user-generated content that feels authentic.
- Format & Placement: Short-form videos, carousels, and interactive formats often outperform static images.
- Offer Framing: Highlight value, scarcity, or social proof in a way that nudges action.
Start with the highest-volume campaigns, set a minimum of 1,000 impressions per variation, and measure results against CTR, conversion rate, and ultimately ROAS. After finding a winner, roll it out across campaigns and use it as the new control for further testing.
Focus on High-Margin Products
Focusing on high-margin products means each conversion brings in more actual profit. In practice, advertisers better allocate ad spend toward products that:
- Maintain at least 3x contribution margin relative to ad cost.
- Consistently convert with a CTR above 1.5–2% in your campaigns.
- Have strong upsell or cross-sell potential to increase average order value (AOV).
Then build campaigns around them, spotlight them in creatives, and test different formats (video, carousel, or UGC) to see which pulls in the most profitable clicks.
Track Blended ROAS
Blended ROAS (Return on Ad Spend) measures your overall revenue against all marketing spend combined, not just a single channel like Facebook or Google.
Here’s how a retailer track blended ROAS in their store:
Start by pulling spend from every channel—Meta, Google, TikTok, email, influencers—and rolling it into one total. That’s your true marketing cost.
Use store revenue as the top line, then divide it by that total spend to get blended ROAS (how many dollars come back for every $1 out). As a rule of thumb, 3x+ is strong, though your margin structure can nudge that target up or down.
Watch the trend, not the day-to-day noise. Track this weekly and monthly to see whether growth is actually sustainable.
Put the number in context. Review blended ROAS alongside your LTV/CAC. A burst of low-cost, one-and-done buyers can make ROAS look pretty, but repeat value is what turns ad spend into real, durable profit.
Smarter Move on Measuring Campaign Effort
Understanding a good ROAS is just the first step toward optimizing your ad campaigns. Bringing customer acquisition cost (CAC), customer lifetime value (CLV), profit margin, and ultimately, net profit together in one view gives you a more comprehensive view of ad performance and its impact on overall business profitability.
That’s where TrueProfit comes in. TrueProfit is a net profit analytics platform built for Shopify sellers, designed to track net profit by automatically calculating all costs—from product COGS, shipping, transaction fees, to marketing spend, so you always see the true bottom line without guesswork.
When it comes to ROAS, TrueProfit shows it in the real-time profit analytics dashboard—in sync with store profitability, giving you the clearest and complete view of campaign effectiveness.
The best part? Sellers don't just measure ad performance based on revenue but by directly looking at true profit-exclusive metrics Net profit on ad spend—measures how much net profit each advertising dollar generates, giving you the clearest signal of whether your campaigns are truly fueling profitable growth, so you move beyond chasing returns and start building campaigns that scale profitably.
Leah Tran is a Content Specialist at TrueProfit, where she crafts SEO-driven and data-backed content to help eCommerce merchants understand their true profitability. With a strong background in content writing, research, and editorial content, she focuses on making complex financial and business concepts clear, engaging, and actionable for Shopify merchants.


 Shopify profits