How To Automate Monthly P&L Statements for Shopify Stores: 6 Tools + A-Z Guide


If building your monthly P&L means hours of exports, spreadsheets, and manual reconciliation, you're not alone.
For many Shopify merchants, month-end reporting is still a repetitive and error-prone process. Automation changes that. Instead of stitching the numbers together by hand, you connect your data once and let a tool pull revenue, costs, and profit into one place for you.
This guide will solve that problem for good: what a Shopify P&L actually includes, why automating it beats a spreadsheet, the 6 best tools every merchant should use, and how to set the whole thing up step by step.
What’s a Profit and Loss Statement?
A profit and loss (P&L) statement is a financial report that summarizes your business's revenue, costs, and expenses over a specific period to show whether you made a profit or a loss.
What a P&L Statement Actually Shows
A profit and loss statement walks your money from the top line down to the bottom line. You begin with gross sales, subtract the cost of the goods you sold to land on gross profit, then take out your operating expenses to reach net profit, or, in a bad month, net loss.
Each layer answers a different question.
Gross sales is everything that came in.
Gross profit tells you how much your products earn after what they cost to make or buy.
Net profit is what's left once every other expense, ads, fees, shipping, software, and overhead, has been paid. It's the number you actually get to keep.
Now compare that to your Shopify sales dashboard. The dashboard tells you what came in. The P&L tells you what you got to keep. Those two figures almost never match, and the space between them is exactly where most merchants leak money without noticing.
The Standard P&L Structure Example
For example, here's how it looks for a Shopify store pulling in roughly $50,000 a month.
Look at that table and it's obvious why "$50,000 in revenue" tells you almost nothing on its own. A store doing $50,000 with $38,200 in costs is in good shape. The same store carrying $48,000 in costs is hanging on by a thread. Same top line, completely different reality, and only the P&L shows you which one you're running.
What an Automated P&L Statement Is
An automated P&L is the same report, built for you instead of by you. Rather than exporting CSVs and typing costs into a spreadsheet each month, you connect your data sources once and a tool assembles the statement on its own.
Here's how it works in practice. The tool pulls orders, refunds, and fees straight from Shopify, imports ad spend from Meta, Google, and TikTok, and applies your COGS at the product level.
It updates as new data lands, so your P&L is always current, and it can deliver a finished monthly report to your inbox or Slack without you triggering anything.

Best Tools to Automate Profit and Loss Statements for Shopify Stores
Rather than spending hours comparing apps, start here. I researched the leading Shopify P&L tools and distilled their key differences into one easy comparison.
1. TrueProfit: #1 Real-Time Net Profit & PnL Tracking
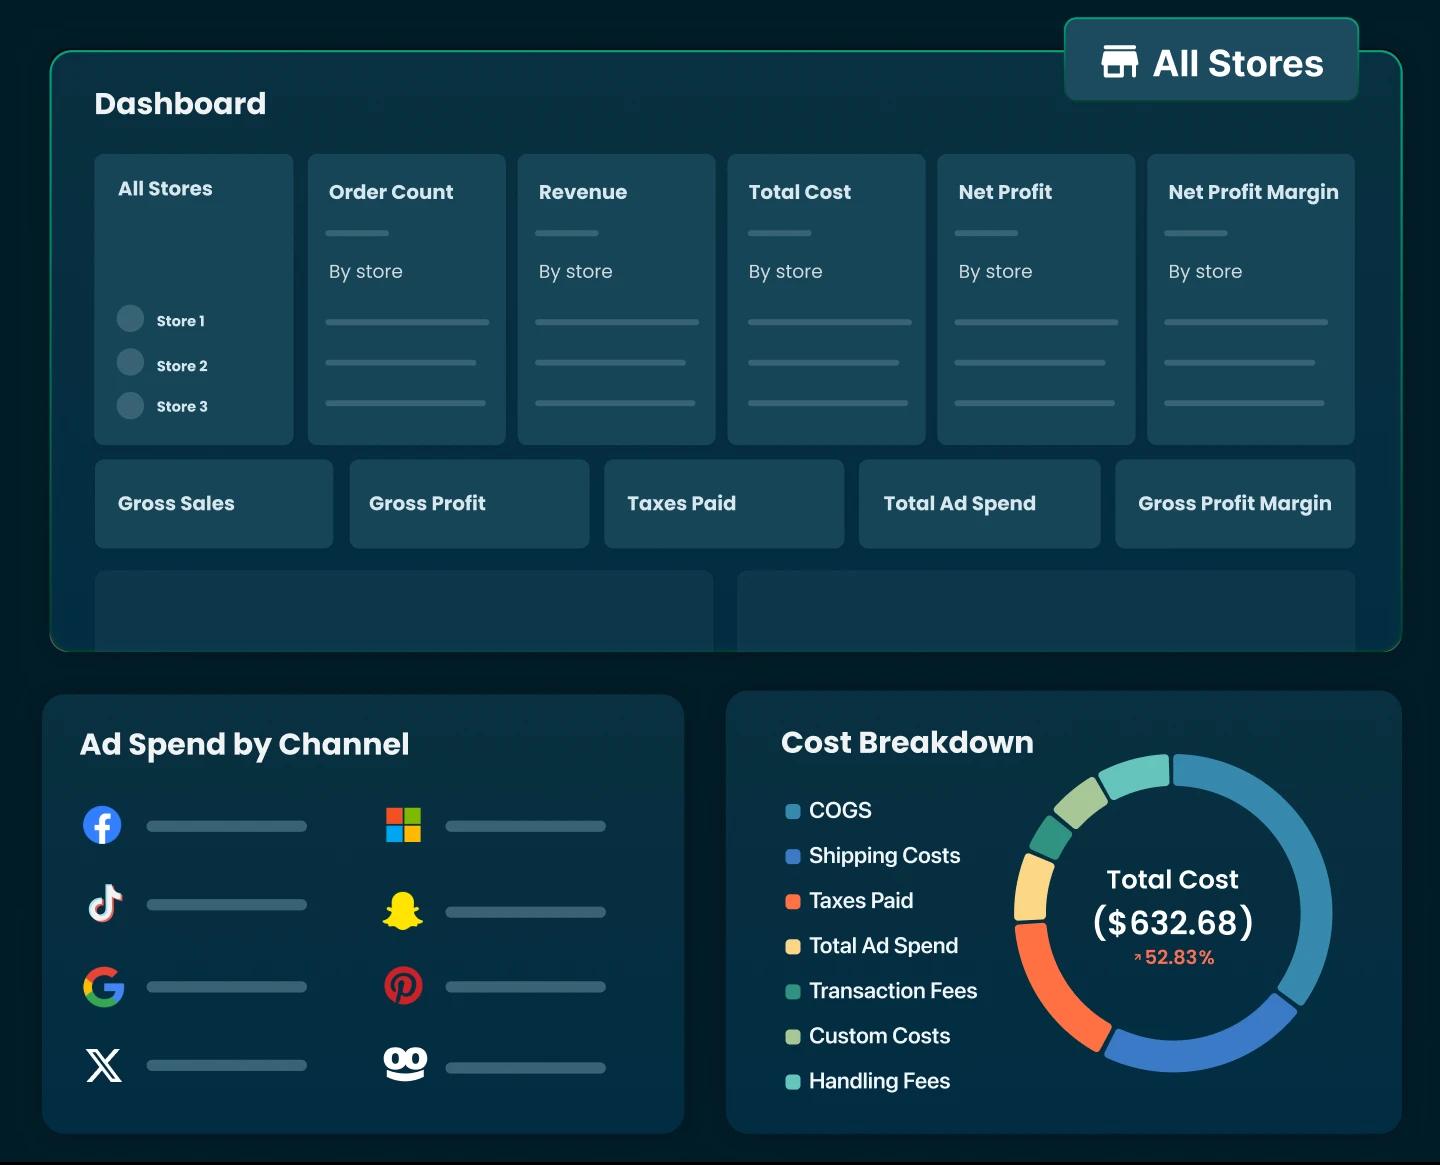
TrueProfit is a net profit analytics platform built specifically for Shopify, focused on one thing above all: showing your store's true net profit in real time.
It plugs straight into your store and pulls orders, refunds, and fees automatically, syncs ad spend from Meta, Google, TikTok, and several other channels, and calculates COGS down to the product and SKU level.
Because it already captures every cost, generating your P&L is automatic: you get a live statement that refreshes throughout the day, plus scheduled email reports daily, weekly, or monthly.

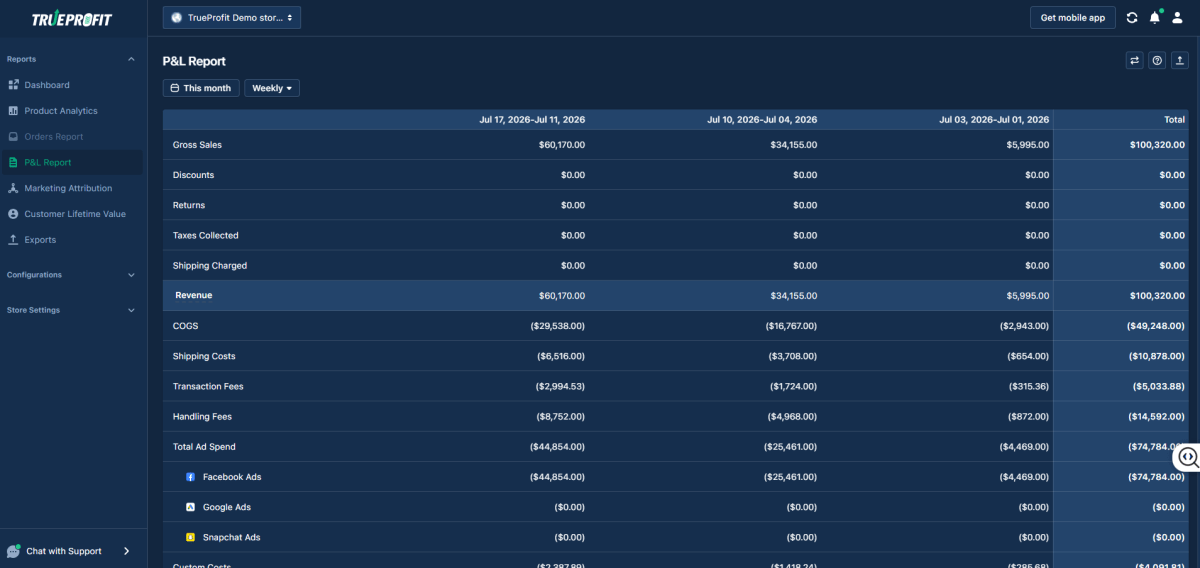
Best for: It's best for merchants who want intraday profit visibility with almost no setup, and one of the few tools that pairs order-level profitability with a store-wide monthly P&L in one place.
Pricing: Paid plans start at $35 a month with a 14-day free trial, and pricing scales with your monthly order volume.
Key features:
- Complete P&L reporting: Track weekly and monthly performance with clear, automated profit statements.
- Real-time net profit dashboard: Instantly see how much you're truly earning after all costs.
- Automatic cost tracking: COGS, ad spend, shipping fees, transaction fees, and more, all synced and calculated accurately & automatically.
- Profit-based product analytics & attribution: Identify your most profitable products and channels to scale the right areas.
- Product-level and ad-level profitability, plus Customer Lifetime Value and cohort analysis
- Customer lifetime value: Understand exactly how much each customer is worth to optimize CAC.
- TrueProfit MCP: Plug TrueProfit into ChatGPT or Claude to instantly ask questions about your store’s performance, build custom dashboards, and uncover the root cause behind sudden changes in your numbers.
2. QuickBooks + A2X: Tax-Ready Bookkeeping
This one is a pairing, not a single tool. QuickBooks (or Xero) is your accounting software, and A2X is the connector that feeds Shopify data into it cleanly.
A2X takes each Shopify payout and posts it as a single reconciled journal entry, splitting out sales, fees, refunds, and taxes, so your books actually tie out to your bank deposits.
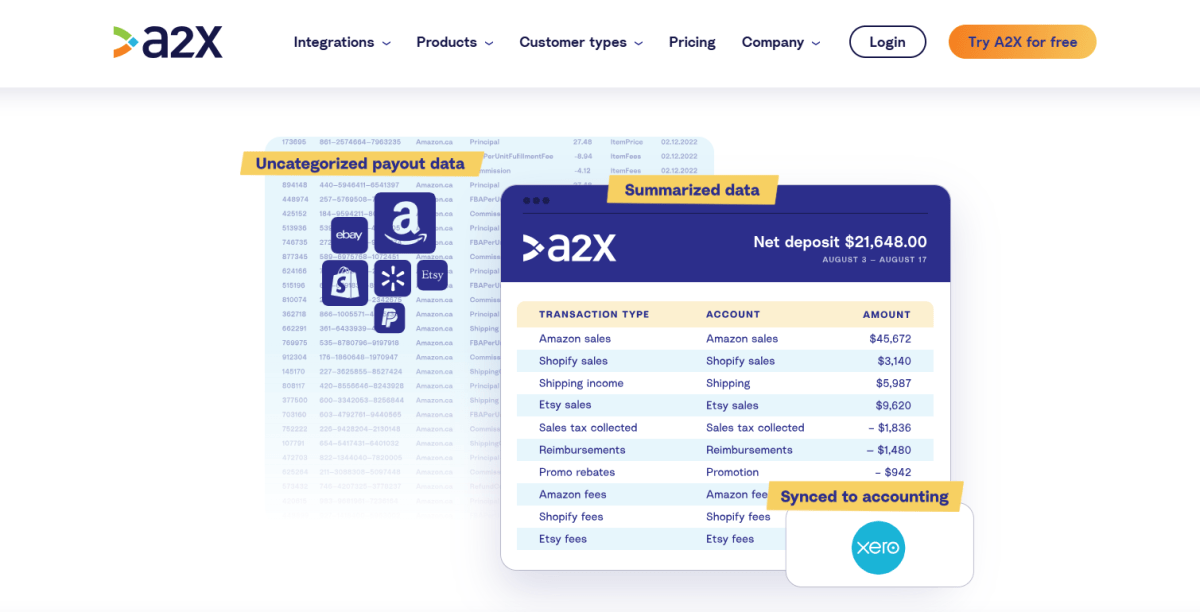
A2X syncs your ecommerce transactions with accounting softwares like Xero, QuickBooks & more
Best for: I'd go this route when you need accountant-ready financials for tax and compliance rather than a marketing dashboard. The tradeoff is setup, since you'll usually map COGS and ad costs by hand.
Pricing: A2X starts at $29 a month for up to 200 orders, and QuickBooks Online runs from $20 a month for the entry plan up to $115 for the Plus tier most ecommerce brands land on.
Key features:
- A2X posts each Shopify payout as a single reconciled journal entry, splitting sales, fees, refunds, and taxes so books tie out to bank deposits
- SKU-level COGS tracking for accurate gross-profit reporting
- Full double-entry accounting in QuickBooks or Xero, built for tax filing, financing, and audits
- Multi-channel support (Amazon, Etsy, eBay, Walmart) if you sell beyond Shopify
3. BeProfit: Custom Reports and Multi-Store Views
BeProfit is a multichannel ecommerce analytics platform for tracking profitability across every store and sales channel you run.
It automatically syncs ad spend from the major platforms and factors in shipping, discounts, and fees, then rolls everything into a P&L you can view by order, product, country, or store, alongside a flexible custom report builder and scheduled email reports.
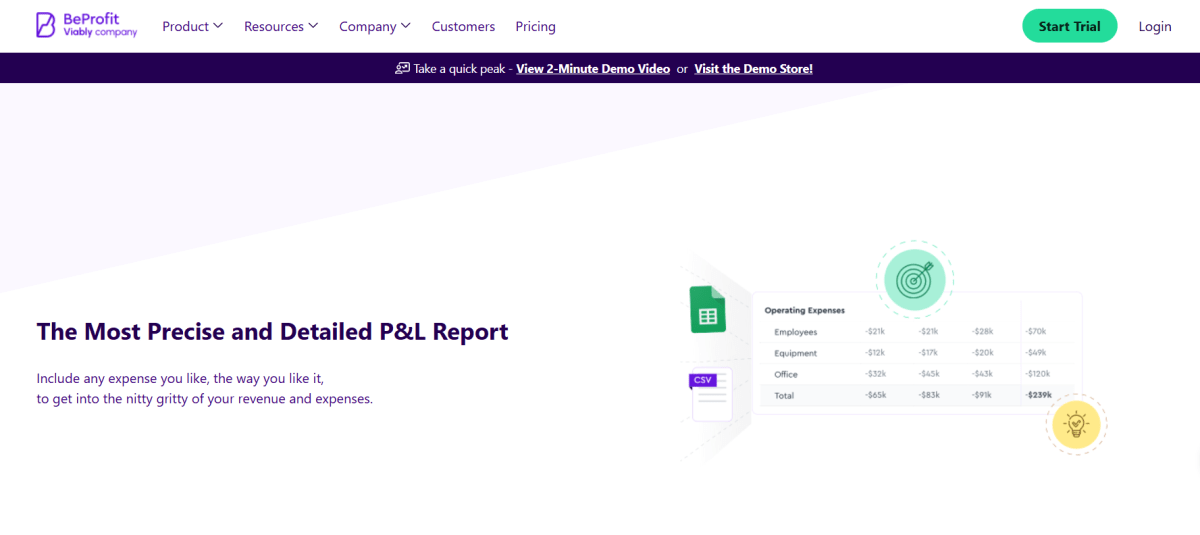
Best for: It suits merchants who run more than one store or want to build reports their exact way.
Pricing: Pricing starts at $49 a month with a 14-day trial and climbs to $249 for the multi-store Plus plan, with tiers tied to order volume.
Key features:
- Real-time profit and loss dashboard with cost breakdowns by order, product, country, and platform
- Automatic ad-spend sync from Meta, Google, TikTok, Snapchat, and Pinterest
- Custom report builder plus scheduled automated email reports
- Cohort analysis for customer LTV and multi-store comparison in a single view
4. Lifetimely: Profit Plus Lifetime Value
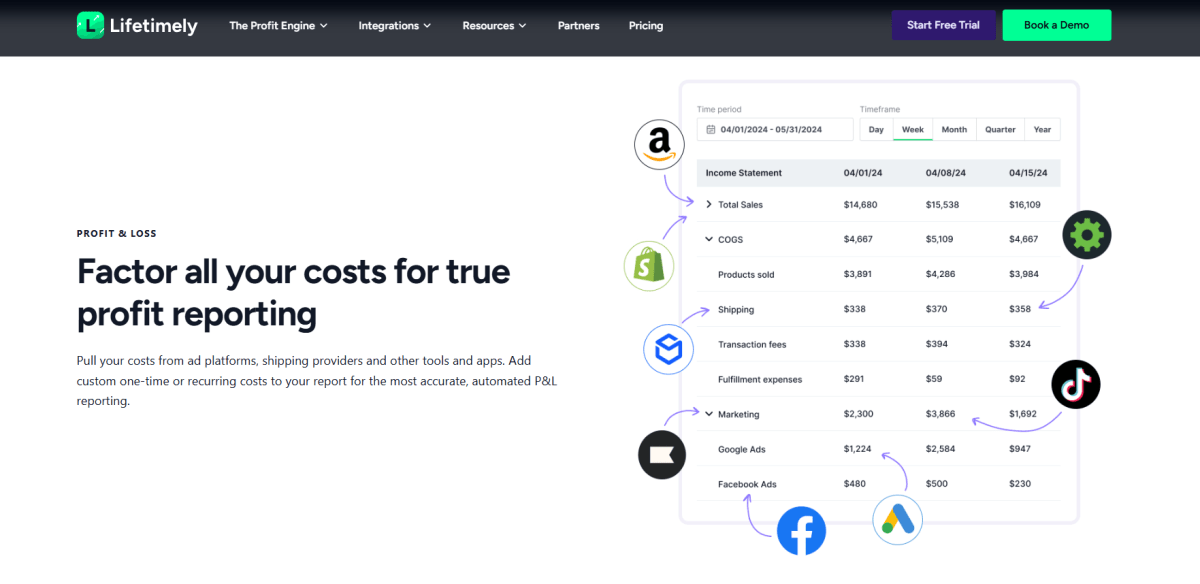
Lifetimely, now part of the AMP suite, is an LTV and profit analytics platform whose core strength is customer lifetime value.
It connects to Shopify and your ad accounts to calculate net profit and build a daily P&L, then goes deeper with cohort analysis and predictive LTV modeling, so you can see what different customer segments are actually worth over time.
Best for: It's built for DTC brands that make decisions on LTV and CAC payback, not just daily revenue.
Pricing: There's a genuinely generous free plan (up to 50 orders a month with all features), but the first paid tier is $79 a month, which is hard to justify below roughly $30,000 in monthly revenue.
Key features:
- Daily automated P&L dashboard covering COGS, ads, shipping, and fees
- Best-in-class LTV cohort analysis segmented by acquisition date, first product, channel, and geography
- Predictive LTV modeling built on $100B+ in GMV across 45,000+ stores
- CAC payback and contribution-margin reporting, with QuickBooks Online, Klaviyo, and Recharge integrations
5. Triple Whale: Attribution for Heavy Ad Spenders
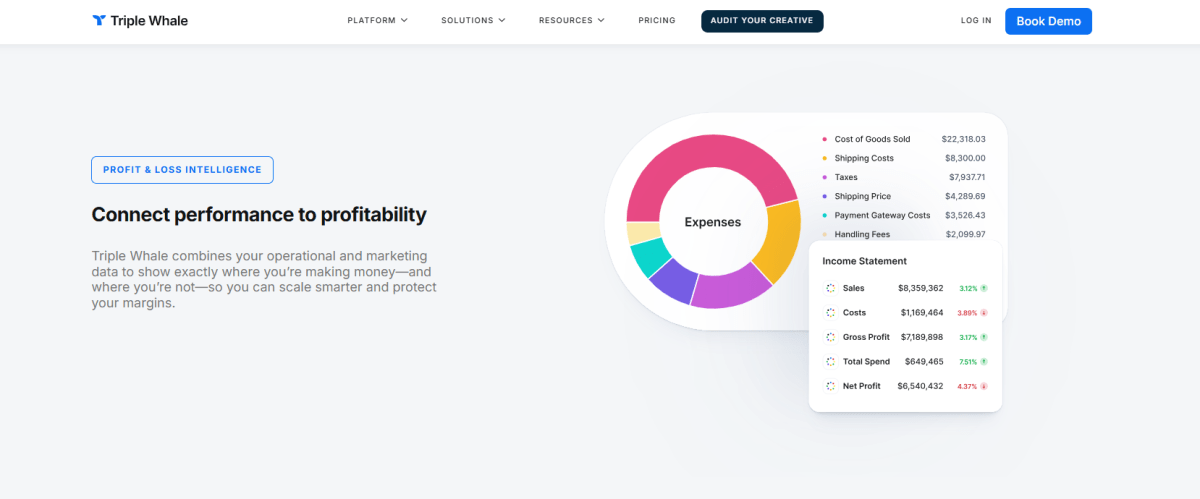
Triple Whale is a Shopify-first analytics and attribution platform. Its standout feature is a first-party pixel that attributes revenue across Meta, Google, and TikTok, layered on top of profit and LTV dashboards.
Unlike accounting tools like QuickBooks or Xero, Triple Whale is not a full P&L system. Its profitability dashboards provide an ecommerce-focused view of performance, helping brands connect revenue, marketing spend, and key profit metrics to understand growth efficiency.
Best for: Shopify brands that need deeper ad attribution, customer insights, and real-time profit visibility, especially those scaling paid acquisition.
Pricing: There's a free tier, then Foundation starts at $219 a month, with pricing that scales up as your annual GMV grows, so the budget for the bill climbs alongside your revenue.
Key features:
- Triple Pixel first-party attribution across Meta, Google, and TikTok, separating real performance from platform-reported numbers
- Real-time blended dashboard unifying ad spend, sales, and profit metrics
- Creative and cohort analytics, plus configurable attribution models and windows
- AI-assisted insights and marketing-mix modeling on higher tiers, with a mobile app
6. Bloom Analytics: Finding the Cost Leaks
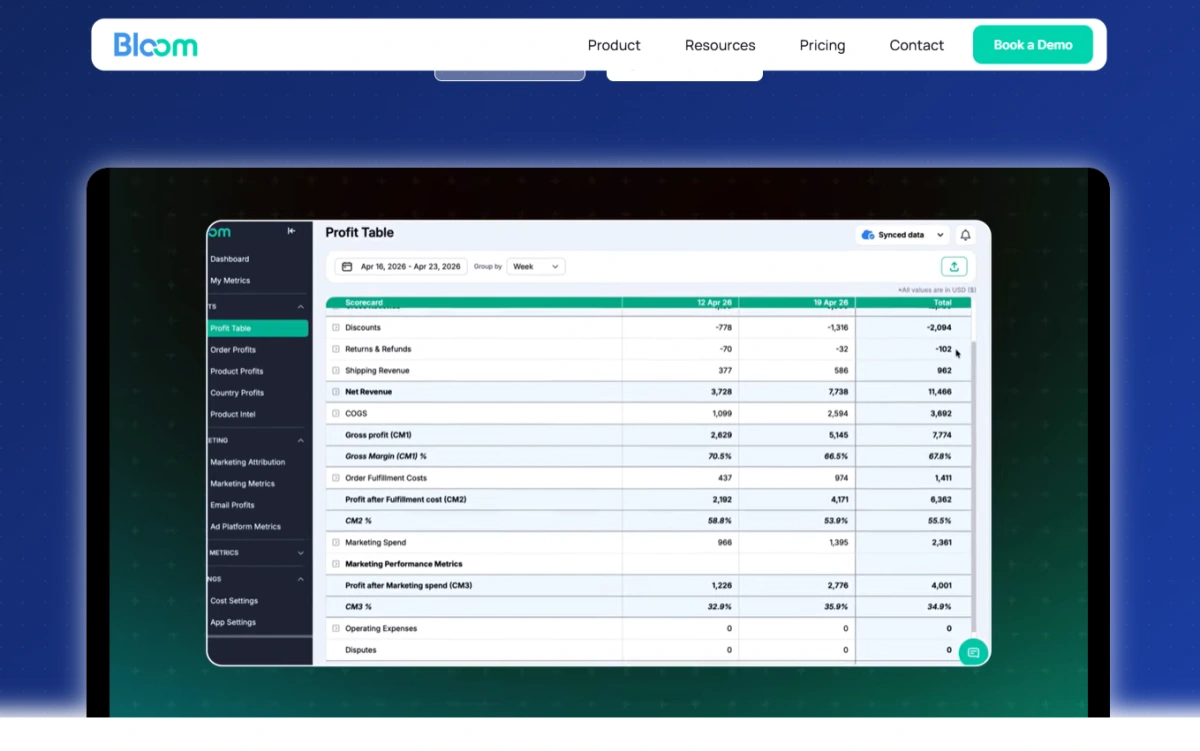
Bloom Analytics is a Shopify-native analytics app focused on attribution and profitability analysis. Its main angle is helping merchants uncover “cost leaks” by showing when products or campaigns appear profitable based on ROAS alone but become less profitable after accounting for real business costs.
The platform consolidates revenue, ad spend, product costs, and key expenses into a P&L-style dashboard, while using first-party tracking technology to improve attribution accuracy and help merchants make better scaling decisions.
Best for: Shopify brands that rely heavily on paid ads and need to uncover hidden costs behind seemingly profitable campaigns.
Pricing: Unlike most competitors, Bloom prices on feature access rather than order volume. It starts at $20 a month with a 14-day trial and goes up to $80 for the top tier.
Key features:
- Consolidated profit reports pulling revenue, ad spend, product costs, and operating expenses into one P&L
- First-party fingerprinting pixel for attribution that bypasses iOS and ad-blocker limitations
- Break-even ROAS and cost-leak analysis to flag products and campaigns losing money after real costs
- Flat, feature-based pricing with unlimited orders and up to three connected stores per plan
Why Shopify Merchants Are Switching to Automated Monthly P&L Statements
Here are 3 key reasons Shopify stores are making the switch:
1. Where Spreadsheets Break Down
Spreadsheets are fine when a store is small, but they buckle as orders, sales channels, and expenses pile up. Once you're stitching together data from Shopify, your ad accounts, suppliers, and payment processors every month, a few problems show up fast.
- First, errors creep in. One wrong formula, a missed expense, or a duplicated row can throw off your profit number without you noticing.
- Second, the insight arrives late; by the time you've collected everything and finished the report, the data is often already stale.
- Third, visibility is limited, since a manual report tells you what happened last month rather than helping you react now.
The result is backwards: you spend more time building the report than acting on what it says.
2. Make Decisions Based on True Bottom Line
Revenue growth and business growth aren't the same thing. A store can grow sales while profit quietly shrinks, eaten up by rising ad costs, higher COGS, shipping, transaction fees, or refunds.
An automated P&L pulls all of that together and shows what's actually left after expenses - net profit. That's how you answer the only question that really matters: is my store getting more profitable, or just busier?
3. Spot Cost Issues Before They Hurt Margins
Profit leaks rarely appear overnight. They build from small shifts that slip under the radar: ad costs ticking up, a supplier nudging prices, fulfillment getting pricier, operational costs creeping higher.
With automated reporting, you catch those changes early and fix them before they take a real bite out of your margin.
How to Read and Act on Your Monthly P&L
A P&L is only valuable if it helps you make better decisions. Instead of skimming the revenue line, review these four metrics every month:
- Gross profit margin to see how much you're making after COGS.
- Net profit margin to understand what your business actually keeps after all expenses.
- Ad spend as a percentage of revenue to make sure customer acquisition remains profitable.
- Month-over-month trends in your biggest cost categories, including COGS, shipping, payment processing fees, apps, and refunds.
Red Flags to Watch For
After checking those numbers, I recommend looking for patterns instead of focusing on any single metric.
If revenue is growing but net profit isn't, that's usually the first sign something is off. In many cases, costs are increasing faster than sales, whether it's advertising, fulfillment, or software subscriptions.
If gross margin starts slipping, I know it's time to review product costs, supplier pricing, or discounting. Even a small drop in gross margin can have a noticeable impact on profitability over time.
I also keep a close eye on ad spend. Spending 25–30% of revenue on acquisition isn't necessarily a problem, but if customer lifetime value isn't increasing alongside it, those extra marketing dollars may not be generating profitable growth.
Finally, I never ignore refunds and returns. They quietly reduce net revenue and profit, and they're easy to overlook if you're only watching sales.
Turning Insight Into Action
One reason I prefer an automated P&L is that it makes the next decision much clearer.
The nice thing about clean data is the next move usually picks itself.
COGS too high? Go back to your supplier or consolidate orders for a better rate.
Ad spend out of control? Kill the campaigns that aren't working and test lower-funnel channels. App costs adding up? Audit them quarterly and cut anything that isn't earning its place.

Final Thoughts
Without an automated P&L, Shopify merchants often make decisions using incomplete numbers: scaling ads that look profitable, promoting products with weak margins, or celebrating sales that don’t translate into cash.
An automated P&L brings every important number together, helping you see the full financial picture behind your store in real time. With accurate profit data available when you need it, you can scale with confidence instead of relying on assumptions.
Because the next stage of Shopify growth isn’t just selling more. It’s knowing what’s actually worth growing.

Harry Chu is the Founder of TrueProfit, a net profit tracking solution designed to help Shopify merchants gain real-time insights into their actual profits. With 11+ years of experience in eCommerce and technology, his expertise in profit analytics, cost tracking, and data-driven decision-making has made him a trusted voice for thousands of Shopify merchants.