The Ultimate Guide to Profitability Analysis 2026 (+ Examples)
Table of Contents
Profitability analysis is the process of evaluating how efficiently a business generates profit. It’s a key part of enterprise resource planning (ERP) and helps business leaders identify ways to optimize profitability.
We’ll walk you through more Harry Chu’s takeaways, along with everything you need to know: definitions, purposes, and proven methods for doing profitability analysis.
Let’s dive in!
In this blog:
What is Profitability Analysis?
Profitability analysis is the process of systematically analyzing the profits generated from different revenue streams — including products, services, customer segments, sales channels, and regions. It’s a key part of enterprise resource planning (ERP) and helps business leaders identify ways to optimize profitability.
It combines both quantitative metrics and qualitative insights. Let’s break it down.
Quantitative metrics refer to the measurable data, such as:
- Gross profit margin
- Net profit margin
- Operating profit margin
- Net Profit on Ad Spend (NPOAS)
- Customer acquisition cost (CAC)
- Customer lifetime value (LTV)
Meanwhile, qualitative insights bring essential context to the numbers. These include:
- Reliability of data sources
- Customer relationship strength
- Operational bottlenecks or risks
- Employee feedback on inefficiencies
You don’t need to limit yourself with the overall profitability analysis. With today’s advanced ERP solutions, companies can analyze profitability at multiple level:
- Customer-level profitability analysis: Which customer groups are the most profitable?
- Vendors-level profitability analysis: Which vendors drive higher margins?
- Product-level profitability analysis: Which products perform best in which regions?
- Campaign-level profitability analysis: Which campaign has the highest return on ad spend?
So what can you actually do with this analysis?

What Is the Purpose of Profitability Analysis?
A profitability analysis report provides the details necessary to fully understand an organization's ability to generate profit. By integrating this process into ERP systems, companies gain a complete view of profitability. This allows decision-makers to:
- Spot high-performing products or services
- Identify unprofitable customer segments or regions
- Allocate resources more efficiently
- Adjust pricing or promotional strategies
- Make data-driven forecasts and growth plans
Now let’s connect the dots to your bottom line.
Why Profitability Analysis Matters for Business?
Profitability report matters because it helps identify areas to cut costs and boost margin. By analyzing the most and least profitable ratio areas, business leaders can focus on strategies that enhance overall profitability and ensure long-term financial stability.
We call this a profit-first strategy: reducing expenses without compromising performance, or reinvesting in what drives the highest ROI. Either way, profitability analysis is the non-negotiable first step. It gives you the clarity to act with confidence and with net profit always top of mind.
Harry Chu, the founder of TrueProfit, believes profitability analysis is no longer optional, it's the lens every modern business needs to see clearly:
6 Key Ratios to Analyze Profitability
Profitability ratios are typically analyzed both individually and compared against industry benchmarks. They fall into two main categories:
Margin ratios, which show profit at various levels of the income statement, and return ratios, which focus on how efficiently a business uses its resources to generate net income.
Generally speaking, the higher the ratio, the better.
1. Gross Profit Margin
Gross profit margin is a profitability ratio that compares gross profit to total revenue, expressed as a percentage. It indicates the percentage of sales revenue remaining after accounting for COGS (cost of goods sold).
2. Operating Profit Margin
Operating profit margin is a profitability ratio that compares operating income (EBIT) to total revenue. It indicates the percentage of revenue that remains after covering all operating expenses, excluding interest and taxes.
3. Net Profit Margin
Net profit margin is a profitability ratio that compares net income to total revenue. It reflects how much of every dollar earned becomes profit, after accounting for all business expenses.
The formula is:
4. Net Profit on Ad Spend
Net profit on ad spend shows the percentage of net profit you earn back on $1 dollar spent on ads. Until now, it's been the most accurate metric to reflect your true profitability from paid marketing.
5. Customer Lifetime Value
Customer Lifetime Value (CLV) is the total amount of profit a customer contributes to your business from the moment they buy until they stop buying.
6. LTV/CAC
LTV/CAC compares how much profit a customer brings in (LTV) to how much it costs to acquire them (CAC). It tells you whether your acquisition efforts are actually paying off.

Example of Performing Profitability Analytics in a Business
It’s not one-size-fits-all. Performing profitability analytics depends on which part of the business you want to measure.
- Gross Margin for product profitability
- Operating Margin for efficiency
- Net Profit Margin to see your bottom line
- Net Profit on Ad Spend for marketing ROI
- CLV or LTV/CAC to evaluate customer value
Different Methods of Profitability Analysis
Profitability can and should be analyzed from different angles. There are 3 main ways to conduct profitability analysis:
1. Horizontal Analysis
Horizontal analysis compares profitability performance across time periods, typically quarterly or yearly. It highlights how metrics like gross profit, operating income, or net profit have increased or decreased, both in dollar amount and percentage.
For example, you might compare gross profit from Q1 to Q2 to identify whether rising revenue is actually translating into stronger margins or if COGS is eating into your profits.
2. Vertical Analysis
Vertical analysis analyzes each line item on your PnL as a percentage of total revenue. Businesses often use vertical analysis to understand the structure of their profitability at every level.
Let’s say your operating profit margin shrinks even though your revenue grows. A vertical breakdown might reveal that fulfillment and marketing expenses are taking up a larger share than before.
3. Cost-Volume-Profit (CVP) Analysis
Cost-Volume-Profit (CVP) analysis is a method used to understand how changes in costs, sales volume, and pricing impact a business’s profitability. It's also called Break-Even Point (BEP) Analysis because the main goal is to find the “break-even point” where:
Total Revenue = Total Costs
(meaning you’re not making a profit, but you’re not losing money either)
Every unit you sell after this point contributes directly to profit.
4. Segment-Based Profitability Analysis
This method breaks down profitability by product, customer segment, sales channel, or even marketing campaign. It’s useful for identifying which areas are driving the most (or least) profit.
For instance, you might learn that 20% of your SKUs drive 80% of your profit or that repeat customers generate 2x more profit than first-time buyers. Tools like TrueProfit automate this segmentation so you don’t have to crunch numbers manually.
5. Contribution Margin Analysis
Contribution margin analysis helps determine how much money from each product sale is left after covering variable costs. This tells you how much each item contributes toward fixed costs and profit. A high contribution margin means you can scale that product more profitably.
6. Trend Analysis
Trend analysis focuses on identifying patterns in your profitability over time, quarter-over-quarter or year-over-year. This is especially useful for forecasting and budgeting.
For example, are your profit margins slowly eroding due to rising returns or shipping costs? With TrueProfit, you can visualize profitability trends across product lines and take action before they cut too deep.
Here’s your catch: Profitability analysis isn’t just about looking back — it’s how you move forward smarter. When you know which products, customers, and campaigns drive true profit, you’re free to double down on what works and ditch what doesn’t.
Ready to simplify all this?
Automate Profitability Analysis with TrueProfit
TrueProfit is a real-time profit analytics app built for Shopify sellers who want complete visibility into their true profitability without spreadsheets.
By automatically pulling in every relevant cost from ad spend and shipping fees to gateway charges, TrueProfit turns complex data into one clear profitability dashboard.

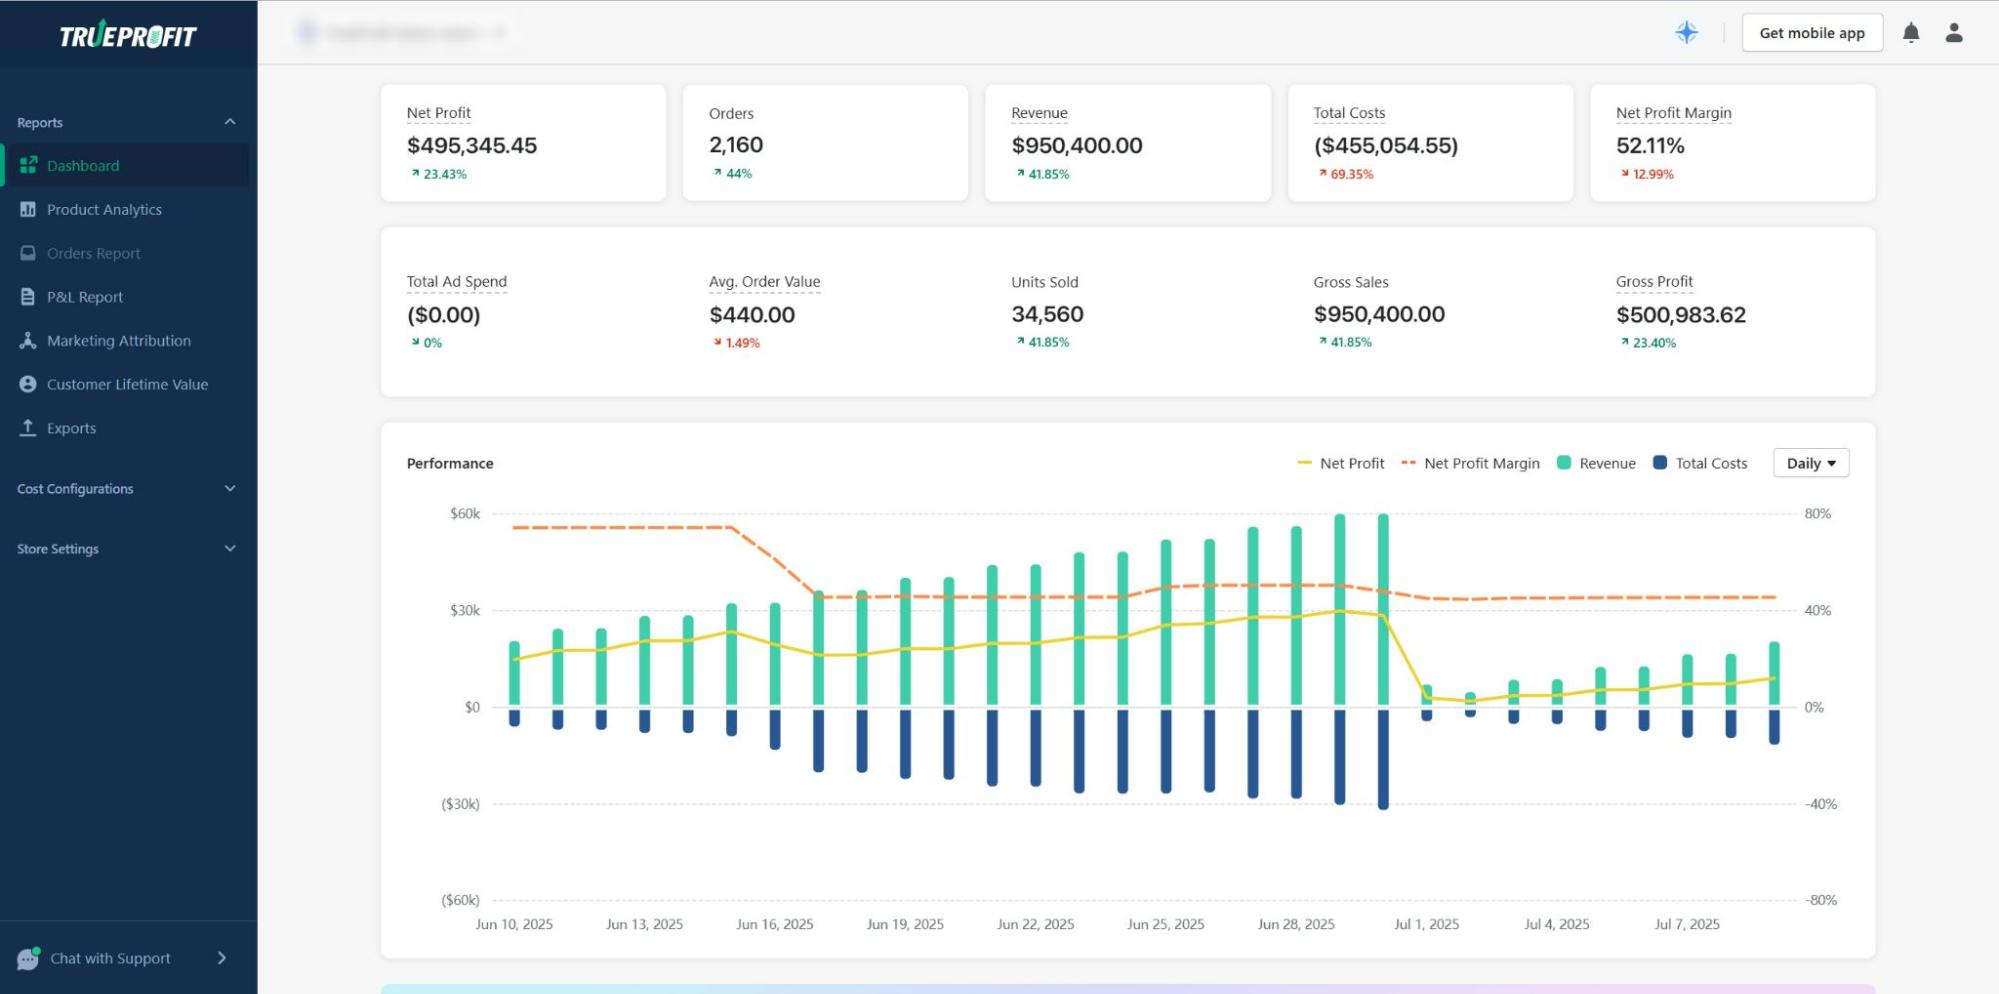
It helps track and analyze profit at every level:
- Product Analytics – See real margins by SKU, track cost changes over time
- Profit Analytics – Monitor net profit and margins in real time
- Marketing Attribution – Track the true profitability of every ad campaign across Meta, Google, TikTok
- Customer Lifetime Value Analytics – Identify your most valuable customers by profit, not order value
- Real-Time Syncing – Ad costs, COGS, and payment fees auto-sync with your store and platforms
Whether you’re scaling, stabilizing, or cutting waste — TrueProfit gives you the kind of clarity that makes confident decisions possible.


Harry Chu is the Founder of TrueProfit, a net profit tracking solution designed to help Shopify merchants gain real-time insights into their actual profits. With 11+ years of experience in eCommerce and technology, his expertise in profit analytics, cost tracking, and data-driven decision-making has made him a trusted voice for thousands of Shopify merchants.