10 Best Ecommerce Reporting Tools For Faster, Smarter Growth in 2026
Table of Contents
If you're switching between Shopify, Meta Ads, Google Analytics, and spreadsheets just to understand yesterday's performance, it's time for a better reporting setup.
In this guide, I'll break down what ecommerce reporting tools are, why they matter, and compare the best solutions in 2026 to help you choose the right one for your business.
In this blog:
What Are Ecommerce Reporting Tools?
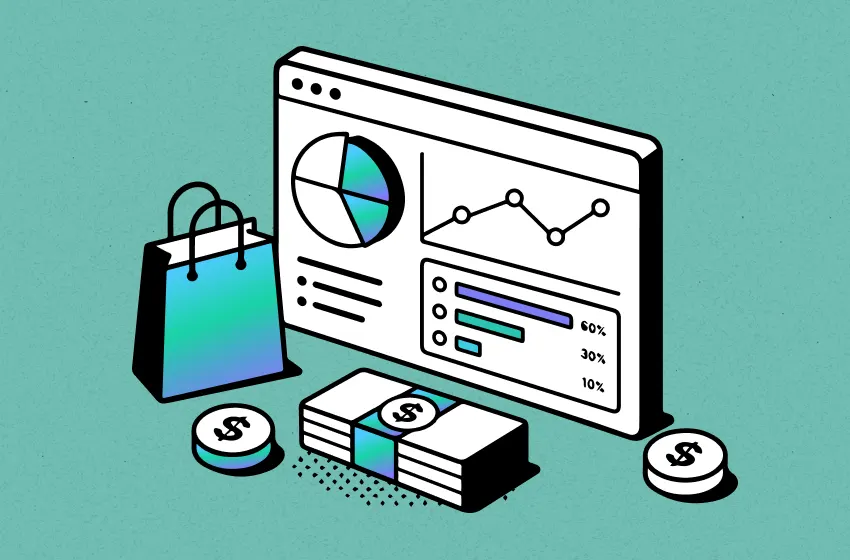
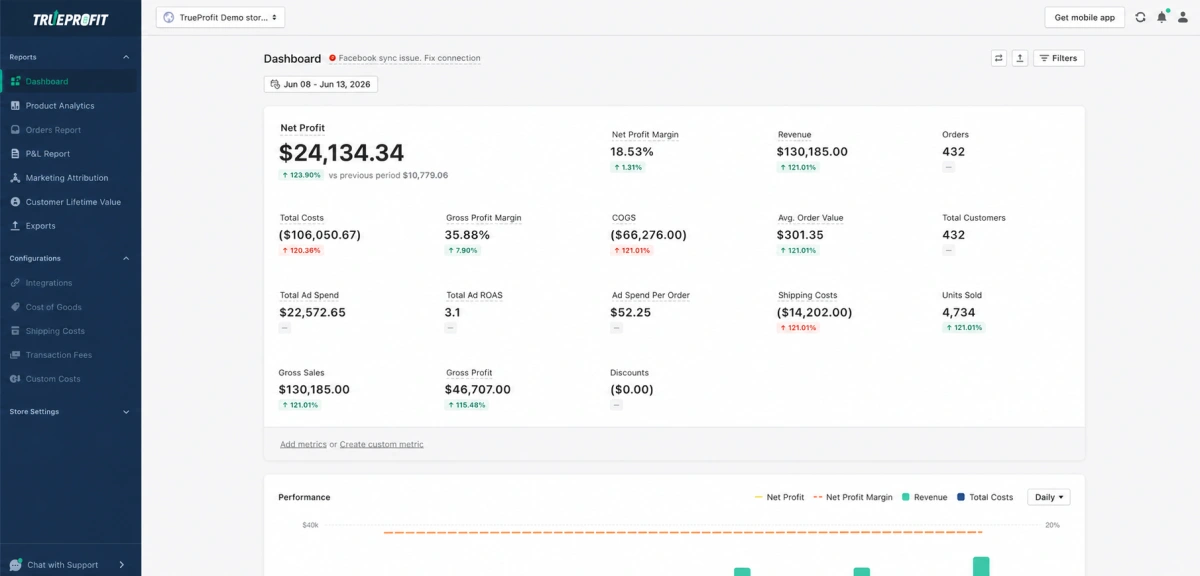
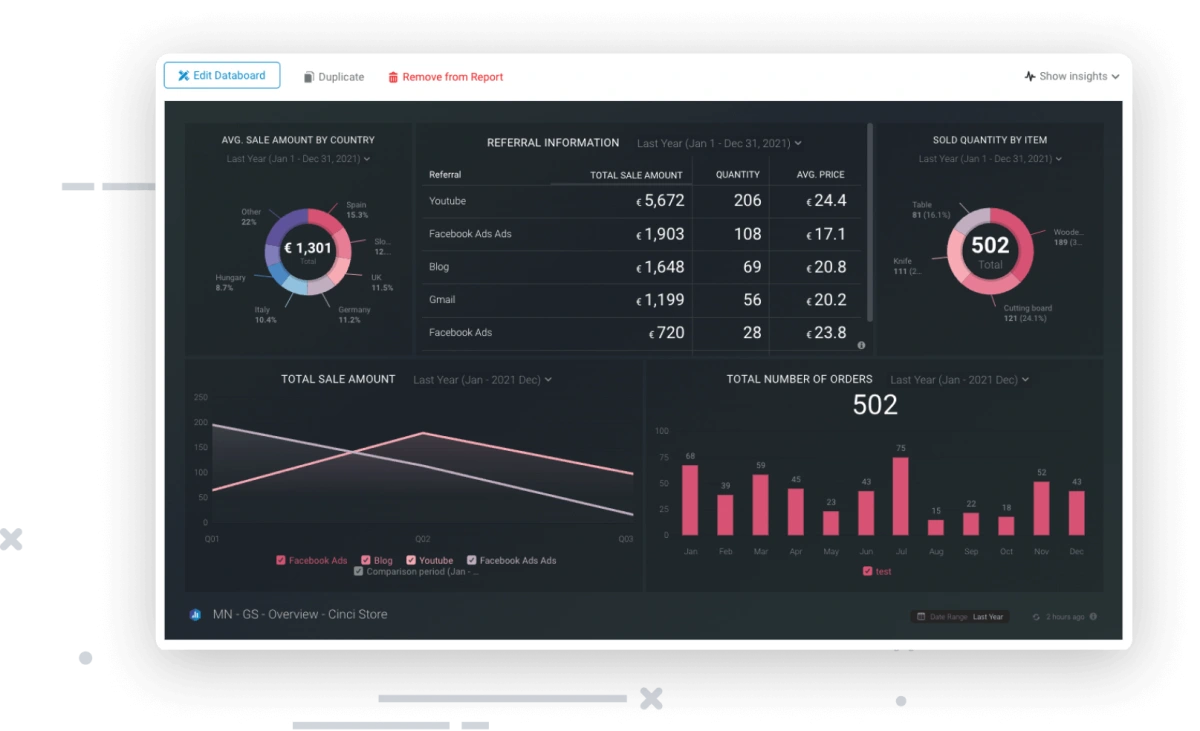
An ecommerce reporting tool is a software application that automatically gathers data from your online store, marketing channels, payment platforms, and other business systems, then organizes that information into reports that help you track performance, monitor key metrics, and review business results over time.

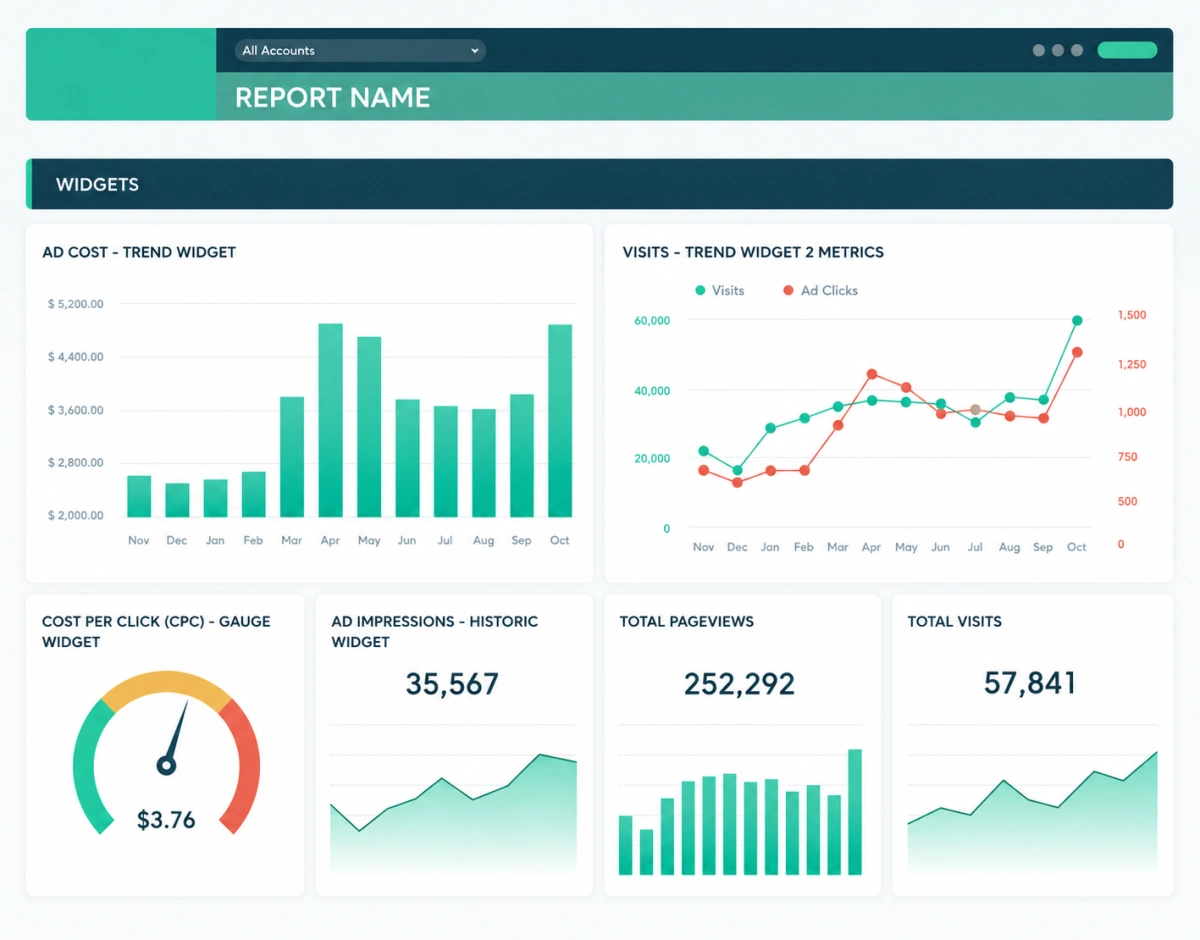
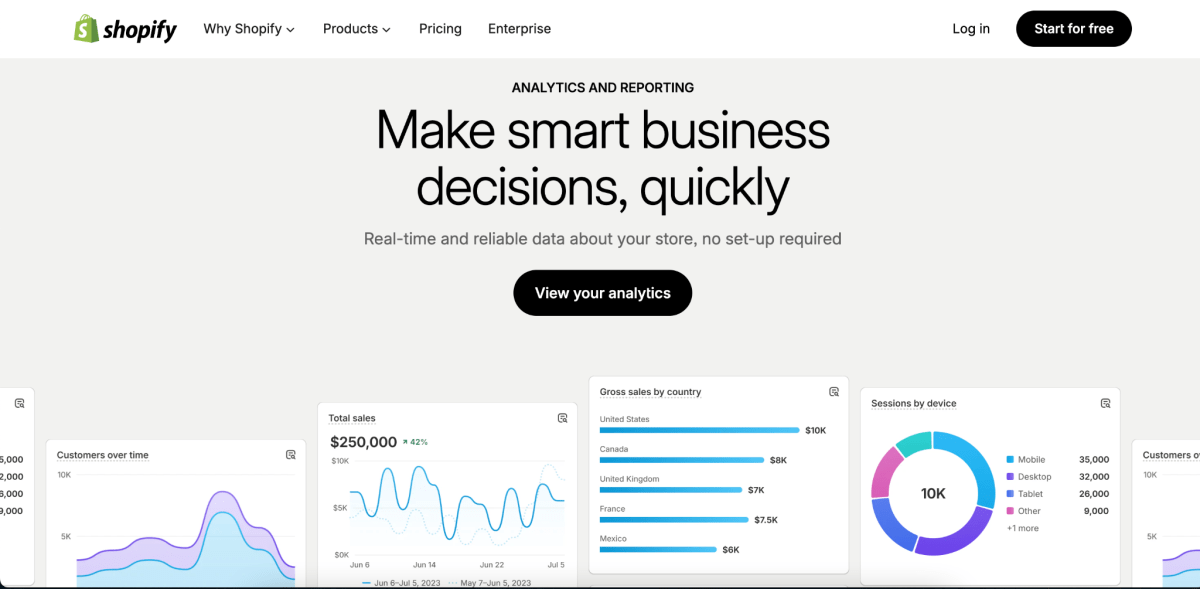
Here's an example of what an ecommerce reporting tool looks like

Analytics Tools vs. Reporting Tools: What's the Difference?
Many ecommerce merchants use the terms "reporting" and "analytics" interchangeably. While the two are closely connected, there are some important differences between them.
While ecommerce reporting tools focus on presenting and distributing business performance data through reports and dashboards, ecommerce analytics tools go a step further by helping users uncover trends, identify patterns, and understand why performance changes occur.
Feature | Ecommerce Reporting Tools | Ecommerce Analytics Tools |
|---|---|---|
Primary Purpose | Organize and present business data through reports and dashboards | Track and analyze data to uncover insights and explain performance |
Key Question Answered | What happened? | What happened and why did it happen? |
Focus | Monitoring KPIs and business performance | Identifying trends, patterns, and growth opportunities |
Data Processing | Collects, consolidates, and visualizes data | Applies deeper analysis, segmentation, and attribution |
Typical Outputs | Scheduled reports, dashboards, KPI summaries | Cohort analysis, attribution models, customer insights, forecasts |
Time Horizon | Historical and current performance tracking | Historical analysis, current insights, and future predictions |
Example Use Case | Generating a weekly report on revenue, orders, and profit | Identifying why conversion rates declined or which channels drive the highest LTV |
Business Value | Provides visibility into performance | Helps optimize strategy and improve outcomes |
The line between the two has become increasingly blurred. Modern SaaS solutions like Triple Whale, TrueProfit, and Polar Analytics combine reporting, dashboards, and advanced analytics in a single product, allowing merchants to monitor performance while also uncovering the insights behind the numbers.
Why Ecommerce Reporting Tools Matter as Your Business Grows
When you're running a smaller ecommerce business or it’s your 1st time running one, it's usually enough to check reports directly in Shopify, Google Analytics, Meta Ads, or Amazon Seller Central. The data is relatively easy to manage, and you can still get a decent sense of how the business is performing.
As your store grows, though, things get more complicated.
Data starts living in multiple systems. Marketing guys focus on ad performance, finance people care about profitability, and operations teams track inventory and fulfillment. The problem is that each platform measures and reports data differently, making it harder to get a clear, unified view of the business.
That's where ecommerce reporting tools come in.
Instead of manually exporting spreadsheets and trying to piece together numbers from different platforms, these tools bring your data into a single reporting environment. This makes it easier to track key metrics, spot trends, and make decisions with confidence.
The real value isn't just having more reports or dashboards. It's having a consistent view of performance across channels, teams, and reporting periods so everyone is working from the same source of truth.
Key Features to Look for in an Ecommerce Reporting Tool
Not all ecommerce reporting tools are built the same.
Some focus primarily on sales reporting, while others provide deeper visibility into marketing performance, customer behavior, and profitability. The right tool depends on your business needs, but there are a few core features worth looking for regardless of your size or growth stage.
- Multi-Channel Data Integration
Ecommerce data is rarely stored in a single place.
Your sales data may live in Shopify, advertising data in Meta and Google Ads, customer data in your email platform, and financial data in your payment processors. A good reporting tool brings these data sources together, giving you a more complete view of business performance without requiring manual data collection.
- Automated & Real-time Reporting
As your business grows, manually exporting reports and updating spreadsheets becomes increasingly difficult to maintain. With real-time performance monitoring, you can track campaigns, launches, and promotions as they happen and react instantly to changes in performance.
- True Profitability Tracking
A good ecommerce reporting tool should help you understand not only how much revenue you're generating, but also how much profit you're keeping. Look for platforms that can calculate gross profit and net profit automatically, giving you a more accurate view of performance at the store, product, order, and marketing channel level.
- Easy Data Sharing and Exporting
Insights are most valuable when they can be shared easily across the business.
Features like scheduled reports, downloadable exports, and shareable dashboards make it easier to keep teams aligned and ensure everyone is working from the same set of metrics.

10 Best Ecommerce Reporting Tools in 2026
The strongest ecommerce reporting tools in 2026 span profit tracking, behavioral analytics, multi-channel aggregation, and platform-specific dashboards, with no single tool covering every use case. Match the tool to the question you're trying to answer, not the other way around.
Here’s is comparison review for you to quickly check:
Tool | Best For | Key Platforms | Starting Price | Standout Feature |
|---|---|---|---|---|
TrueProfit | Real-time profit tracking | Shopify | 14-day free trial (paid plans start at $35/month) | Net profit per store, product, order, ad channel |
Google Analytics | Traffic and behavior | All platforms | Free | Funnel and attribution analysis |
Supermetrics | Multi-channel data aggregation | All platforms | $55/mo | 100+ data source connectors |
Triple Whale | DTC ad attribution | Shopify | Free (paid plans start at $219/mo) | Pixel-based attribution |
Databox | Custom KPI reports | Multi-platform | Free tier available | Drag-and-drop dashboard builder |
DashThis | Automated marketing reports | Multi-platform | ~$54/mo | White-label client reports |
Glew.io | Multichannel ecommerce intelligence | Shopify, WooCommerce, BigCommerce | Custom pricing | Customer segmentation |
Metorik | WooCommerce and Shopify reporting | WooCommerce, Shopify | ~$25/mo | Profit and cost tracking dashboards |
Shopify Analytics | Basic built-in reporting | Shopify | Included with Shopify plan | Native Shopify integration |
Looker Studio | Custom free report building | All via connectors | Free | Fully customizable reports |
1. TrueProfit
Best for: Shopify merchants who want an accurate and real-time view of their true bottom line (net profit) instead of stitching together spreadsheets
What it does
TrueProfit is the #1 net profit analytics platform built natively for Shopify. It pulls every important store metrics from COGS, shipping costs, transaction fees, taxes, and ad spend from Meta, Google, and TikTok, then calculates real net profit at the order, product, and store level in real time rather than relying on top-line revenue or platform-reported ROAS.
Key Features
- Real-time net profit dashboard: Instantly see how much you're truly earning after all costs.
- Automatic cost tracking: COGS, ad spend, shipping fees, transaction fees, and more, all synced and calculated accurately & automatically.
- Profit-based product analytics & attribution: Identify your most profitable products and channels to scale the right areas.
- Complete P&L reporting: Track weekly and monthly performance with clear, automated profit statements.
- Customer lifetime value: Understand exactly how much each customer is worth to optimize CAC.
- TrueProfit MCP: Plug TrueProfit into ChatGPT or Claude to instantly ask questions about your store’s performance, build custom dashboards, and uncover the root cause behind sudden changes in your numbers.
Why it matters
Most Shopify merchants check the Shopify dashboard or rely on spreadsheets to understand their business. The problem is that Shopify focuses on revenue, while spreadsheets are manual, delayed, and often miss costs scattered across different platforms.
TrueProfit was built to solve this by automatically bringing every cost together and showing the one number that matters most at the end of the day: your real-time net profit.
Pros
- Advanced COGS tracking system that handles complex product costs accurately, giving merchants a precise view of true margins and profitability
- Wide range of integrations with ad platforms, shipping providers, payment gateways, dropshipping tools, and POD services to automatically sync data and reduce manual work
- Custom cost and formula support that allows users to define and calculate costs based on their own business logic
- AI-ready data layer that connects with AI models, enabling custom dashboards and real-time profit insights through natural language queries
- Responsive support team that is highly helpful during onboarding, setup, and ongoing troubleshooting
Cons
- Shopify-only; not yet available for WooCommerce or BigCommerce
- No permanent free plan, only a 14-day free trial
- Pricing scales with monthly order volume, so cost rises as the store grows
2. Google Analytics 4
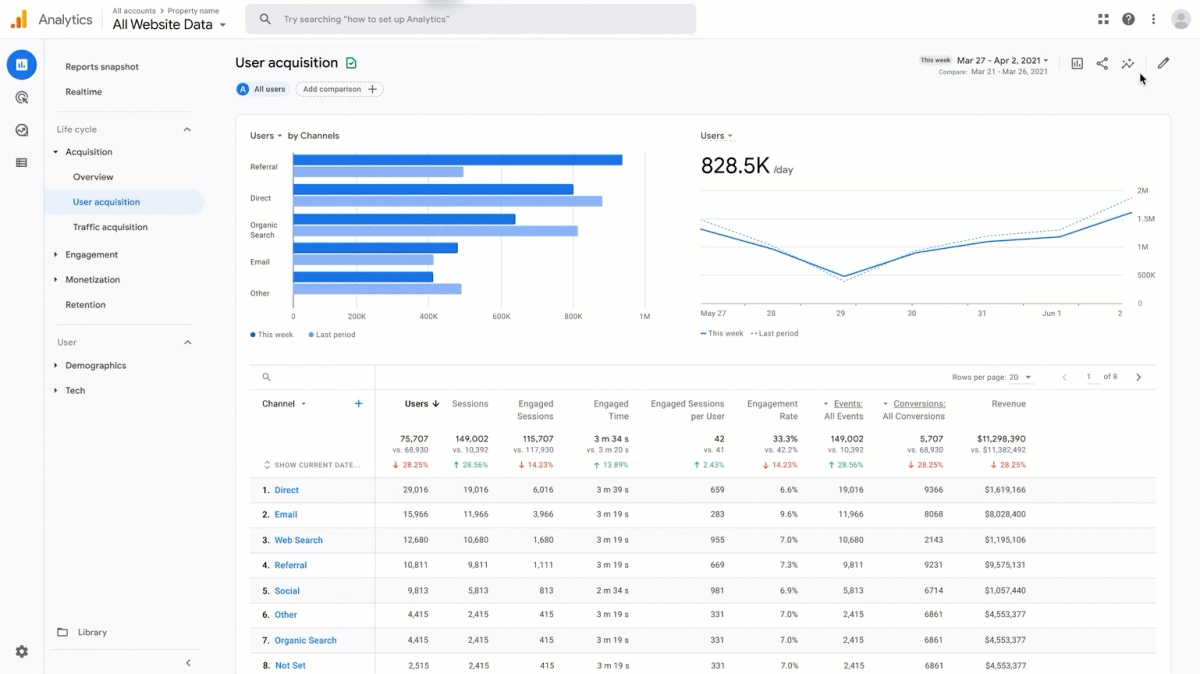
Best for: Any store that needs a free baseline for traffic, behavior, and funnel analysis
What it does
GA4 is Google's free web analytics platform. It tracks traffic sources, on-site behavior, and conversion funnels, and supports attribution modeling across channels, but it requires ecommerce-specific event tracking to be configured (usually through Shopify's native integration or Google Tag Manager) before it shows meaningful store data.
Key Features
- Scheduled and shared reports across teams
- Conversion event tracking once ecommerce events are configured
- Behavior-based audience segmentation
- Alerts for significant traffic or conversion anomalies
Why it matters
GA4 is widely used as a baseline analytics layer for ecommerce businesses, helping track traffic sources, user behavior, and conversion paths across channels. Even when brands rely on other reporting tools for revenue or profit, GA4 often provides the behavioral context behind those numbers.
Pros
- Free to use with no usage limits for most ecommerce stores
- Strong behavioral analytics with detailed funnel and user journey visualization
- Flexible attribution modeling to understand how different channels contribute to conversions
- Deep integration with Google ecosystem (Google Ads, Search Console, BigQuery) for expanded reporting capabilities
- Highly customizable event tracking, allowing teams to measure almost any on-site action
Cons
- No profitability data; it stops at revenue and conversions
- Requires technical setup for accurate ecommerce event tracking
- Steeper learning curve than purpose-built ecommerce dashboards
3. Supermetrics
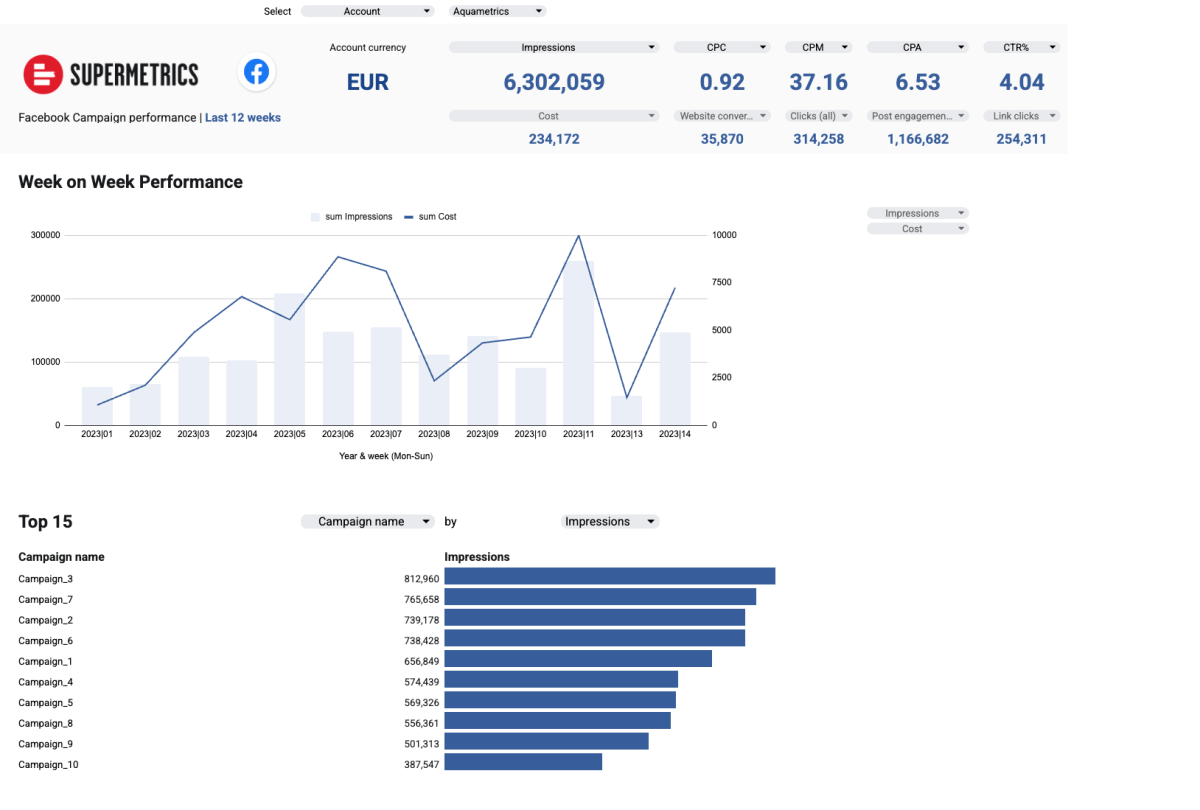
Best for: Teams that need to centralize data from many platforms into a spreadsheet or BI tool
What it does
Supermetrics is a data connector and pipeline tool. It pulls data from over 100 sources, including ad platforms, CRMs, and ecommerce platforms, and pushes it into Google Sheets, Looker Studio, Excel, or a data warehouse.
Key Features
- Scheduled data refreshes from connected sources (weekly, daily, or hourly depending on plan)
- Multi-source data blending into a single sheet or report
- Historical data backfills when first connecting a source
- Custom connector building for sources without native support
Why it matters
For teams already standardized on Sheets, Excel, or Looker Studio, Supermetrics removes the manual export-and-paste work that eats hours every reporting cycle, without forcing a switch to a new dashboard tool.
Pros
- Enormous connector library spanning ad platforms, CRMs, and ecommerce tools
- Flexible output destinations instead of locking you into one dashboard
- Custom Connector Builder for non-native data sources
Cons
- No built-in dashboards; a destination tool is still required to visualize the data
- Per-destination pricing means using both Sheets and Looker Studio requires two subscriptions
4. Triple Whale
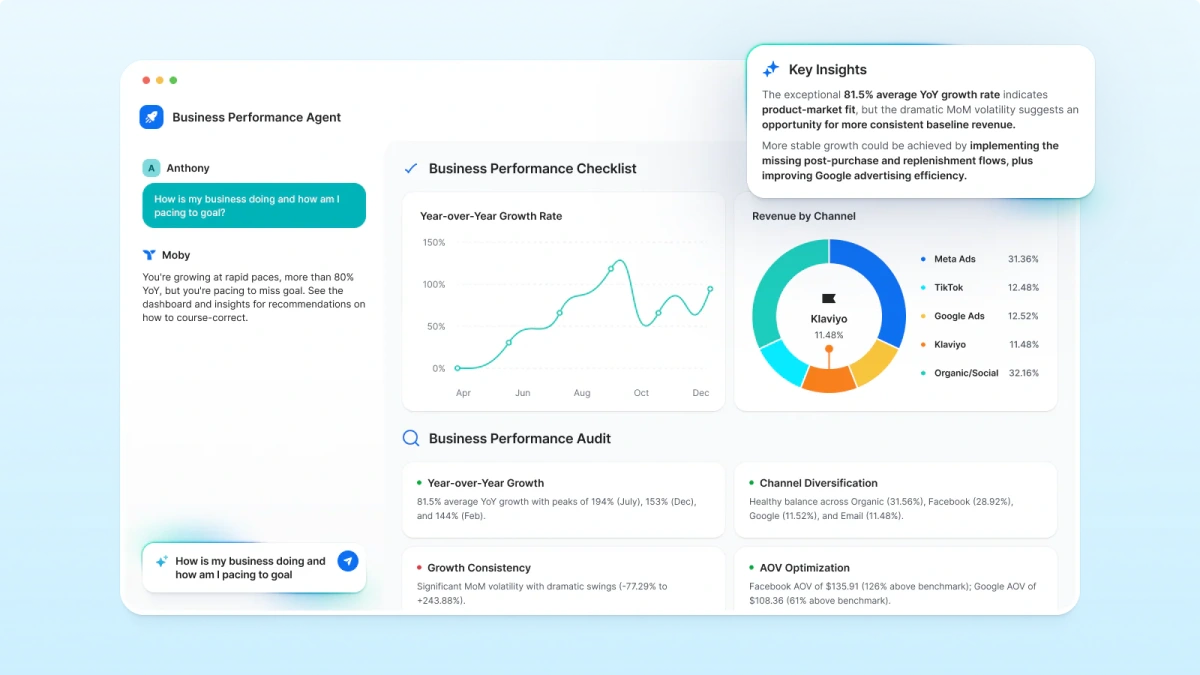
Best for: DTC brands that need pixel-based ad attribution beyond what ad platforms self-report
What it does
Triple Whale is a Shopify-focused attribution and analytics platform. Its pixel tracks the customer journey across touchpoints and assigns sales credit more accurately than platform-reported data, and its AI layer, Moby, lets merchants ask plain-language questions about performance. Newer "Moby Agents" can also take actions like adjusting ad bids, on supported plans.
Key Features
- Pixel-based multi-touch attribution across all customer touchpoints
- Unified dashboard combining Shopify, Meta, Google, and TikTok data
- Creative-level performance breakdown by ad, hook, and format
- Profit tracking that combines revenue, COGS, and ad spend
- Moby AI for natural-language performance queries
- Moby Agents for automated budget and bid optimization (higher tiers)
Why it matters
Ad platforms tend to over-report their own contribution to a sale. A more accurate attribution view changes which channels actually deserve budget, which can move real dollars at scale.
Pros
- More realistic attribution compared to platform-reported ROAS (which often over-credits itself)
- Strong visibility into incrementality and creative performance
- Beginner-friendly dashboards for founders and operators
- Free tier available for early-stage testing
- Purpose-built for Shopify DTC workflows
Cons
- Pricing increases quickly with GMV and ad spend scale
- Shopify-first ecosystem (limited support for non-Shopify stacks)
- Attribution is still model-based, not deterministic truth
- Advanced AI automation features locked behind higher-tier plans
5. Databox
Best for: Ecom teams that want custom KPI reports without writing code
What it does
Databox connects to 70+ integrations and lets users build custom scorecards and KPI reports through a drag-and-drop interface. It's a general business intelligence tool rather than an ecommerce-specific one, commonly used to combine marketing, sales, and ecommerce metrics in one view.
Key Features
- Drag-and-drop dashboard builder for custom KPIs
- Goal tracking with real-time performance updates
- Automated report scheduling via email or Slack
- KPI scorecards for executive-level reporting
- Data blending across marketing, sales, and ecommerce sources
Why it matters
For teams that need one shared view across departments rather than separate exports from each tool, Databox cuts the manual work of assembling a weekly update deck.
Pros
- Drag-and-drop interface with no coding required
- Goal tracking and benchmarking features
- Unlimited users included on paid plans
- Flexible across multiple business types
- Strong for weekly business reporting
Cons
- Not ecommerce-specific (no deep profit tracking)
- Limited advanced analytics capabilities
- Connector costs can add up
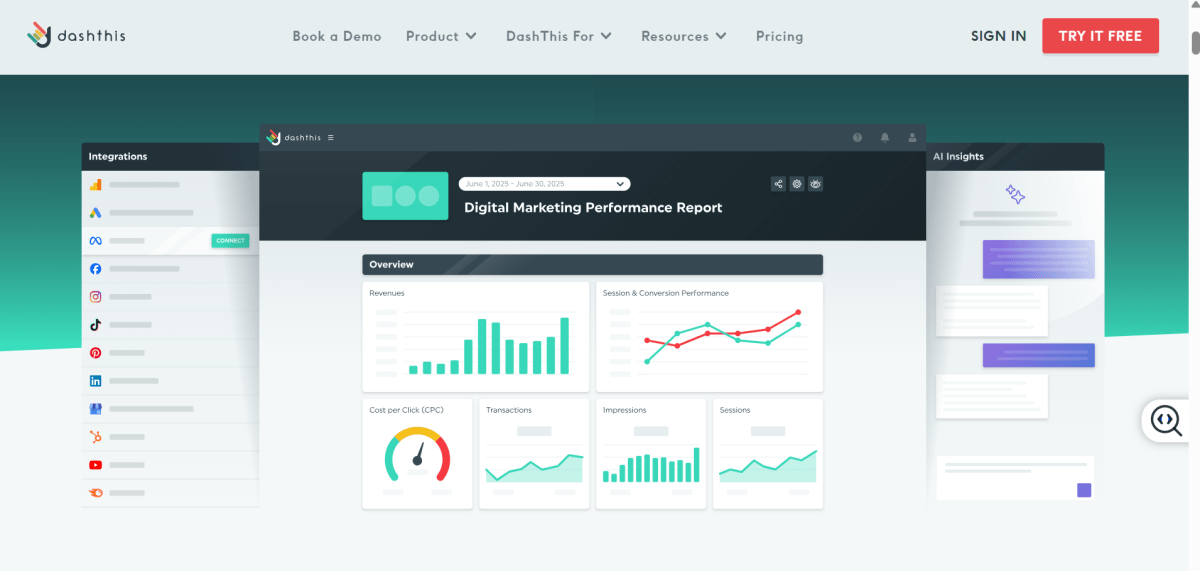
6. DashThis
Best for: Agencies that need recurring, white-labeled marketing reports for clients
What it does
DashThis builds client-ready marketing reports from templates. Once sources are connected and a schedule is set, it generates and distributes reports automatically, which is why agencies managing several accounts rely on it instead of building reports manually each cycle.
Key Features
- Scheduled report generation and distribution
- White-label branding for client-facing reports
- Multi-source report templates across major ad and marketing platforms
- Recurring exports without manual rebuilding each period
- Multi-client account management in one workspace
- Integration with major ad and analytics platforms
Why it matters
Agencies billing for reporting time can reclaim those hours, and brands managing multiple stakeholders get consistent, branded updates without someone manually assembling slides every week.
Pros
- Pre-built templates for common marketing report types
- White-label branding included
- Simpler setup than building reports from scratch
- Fast setup with minimal configuration
- Clean, client-ready report formats
- Standardized reporting across multiple accounts
Cons
- Not ecommerce-specific; it's a general marketing reporting tool
- Pricing now scales with both the number of dashboards and connected data sources
7. Glew.io
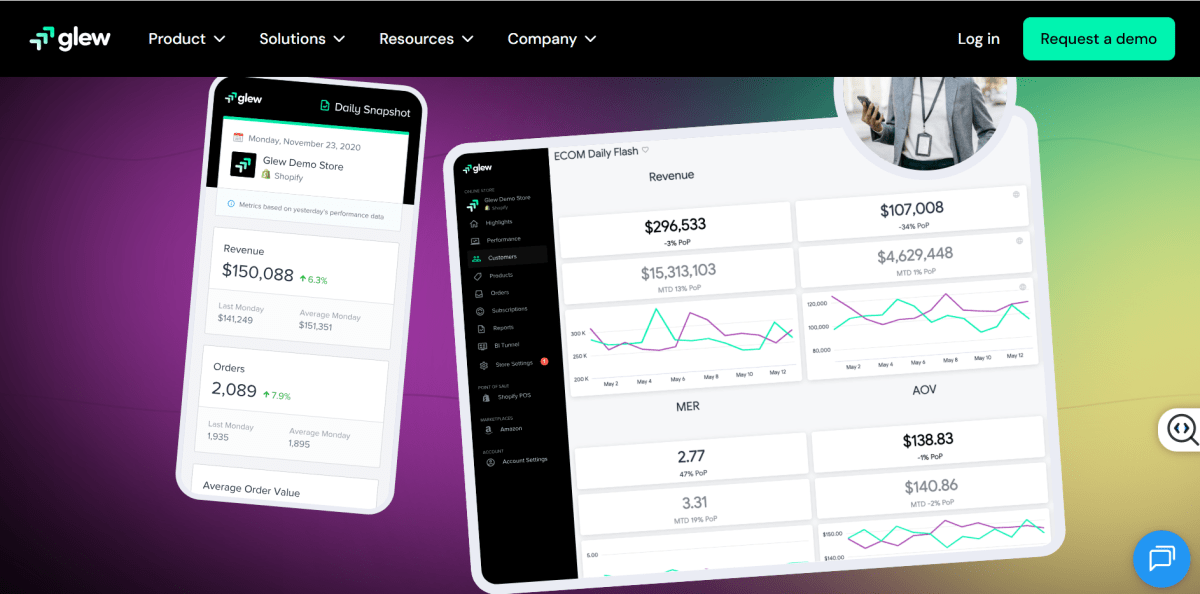
Best for: Mid-size multichannel ecommerce brands that want deep customer and product segmentation
What it does
Glew.io is an ecommerce-specific business intelligence platform covering sales, customer behavior, product performance, and inventory across Shopify, WooCommerce, BigCommerce, and other channels, with 150+ pre-built integrations for combining data sources.
Key Features
- Automated reports and alerts across connected sales channels like Shopify, Amazon, and ad platforms
- Customer segmentation based on purchase behavior, LTV, and cohorts
- Inventory and product performance tracking
- Scheduled data syncing across 150+ integrations
- Automated reporting and KPI alerts
Why it matters
For stores selling across more than one channel, manually reconciling customer and product data from each platform is time-consuming. Glew's segmentation tools are built specifically to make that cross-channel view usable.
Pros
- Gives a single view of customer behavior across Shopify, Amazon, and ads
- Helps identify high-value customer segments for retention and upsell strategies
- Makes it easier to understand which products actually drive profit, not just revenue
- Supports better inventory decisions by linking sales trends with demand signals
- Helps mid-size brands move from basic reporting to deeper business intelligence
Cons
- Custom pricing can get expensive at scale
- Less commonly reviewed and benchmarked than larger competitors
- No published free plan
8. Metorik
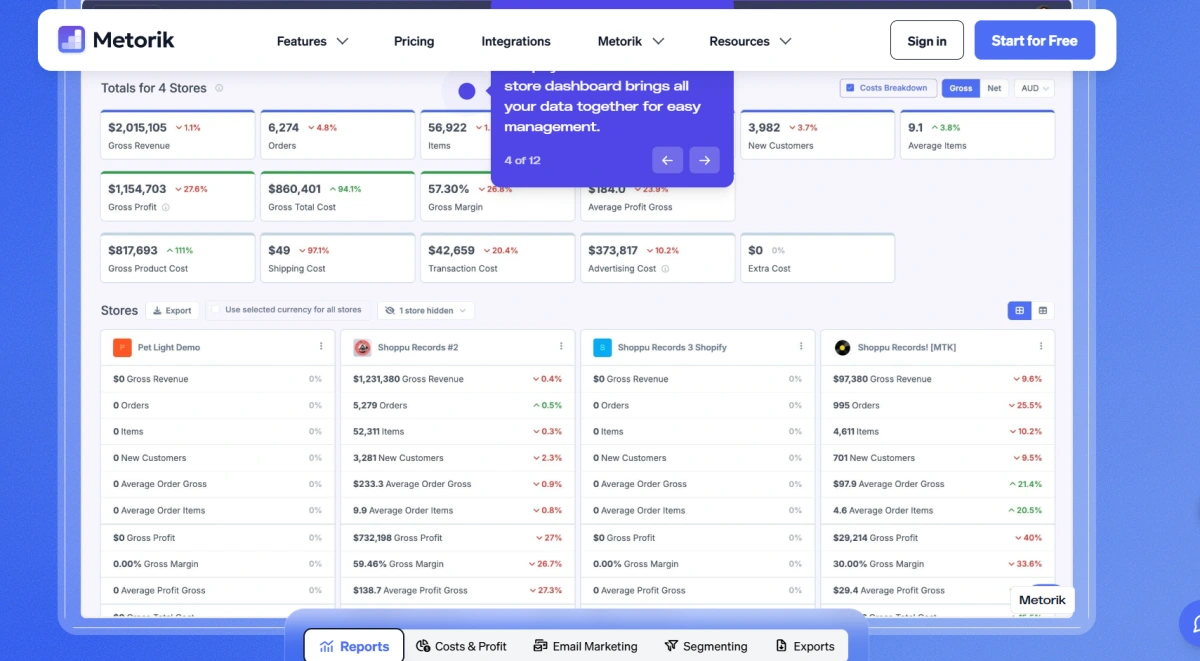
Best for: WooCommerce and Shopify stores that want reporting and cost tracking without custom configuration
What it does
Metorik started as a WooCommerce-only analytics tool and has since expanded to support Shopify as well. It connects directly to a store to deliver real-time dashboards, customer segmentation, cohort and lifetime value reporting, and cost and profit tracking (including COGS), with optional email automation built on the same underlying data.
Key Features
- Real-time sales, customer, and product dashboards
- Cohort and LTV reporting by customer segment
- Cost and profit tracking at the product or variation level
- Abandoned cart and lifecycle email automation (optional add-on)
Why it matters
Because Metorik now layers cost and profit tracking on top of its reporting, it overlaps with what dedicated profit tools offer, which is worth knowing when comparing it against a tool like TrueProfit for that specific use case.
Pros
- Shows real-time store performance without needing manual reporting tools
- Helps understand customer lifetime value and repeat purchase behavior quickly
- Makes it easy to track true profit per order including costs and fees
- Reduces need for multiple tools by combining analytics + profit tracking
- Simple setup so founders can start analyzing data immediately
Cons
- Pricing scales automatically with monthly order volume, so costs rise as the store grows
- Fewer non-ecommerce integrations than broader BI platforms like Databox or Supermetrics
9. Shopify Analytics
Best for: Shopify beginners who want reporting with no extra setup or cost
What it does
Shopify Analytics is the built-in reporting suite included with every Shopify plan, covering sales, customer behavior, marketing attribution, and basic finance overviews directly inside the Shopify admin.
Key Features
- Native sales reporting inside Shopify admin
- Basic channel-level marketing attribution
- Customer behavior and retention reports
- Finance overview including discounts and refunds
- CSV export for external analysis
Why it matters
For new or small stores, it removes the need to install a third-party app just to see sales trends, even though it stops well short of true profitability reporting.
Pros
- Gives instant visibility into store performance without setup or integrations
- Provides reliable first-party sales data directly from Shopify
- Useful for quick daily checks like revenue, orders, and conversion rate
- No learning curve, even for first-time store owners
- Completely free and always available inside Shopify admin
Cons
- Shallow profitability data with no profit-after-costs view
- Limited customization compared to dedicated analytics tools
- Less useful for multi-store or multichannel businesses
10. Looker Studio
Best for: Teams that want a fully custom, free report builder inside the Google ecosystem
What it does
Looker Studio, formerly Google Data Studio, is Google's free report-building tool. It connects natively to GA4 and Google Ads, plus hundreds of third-party connectors (including Supermetrics), letting users build fully custom reports and dashboards from scratch.
Key Features
- Scheduled report emails to stakeholders
- Data refresh from connected sources
- Custom calculated fields and blended data sources
- Shareable, view-only dashboard links
Why it matters
Because it's free and infinitely customizable, it's often the final destination tool that other platforms (like Supermetrics) feed into, rather than a replacement for ecommerce-specific reporting.
Pros
- Allows full control over how dashboards and reports are built
- Enables combining ecommerce, ads, and analytics data into one view
- Completely free, even for large-scale reporting setups
- Highly scalable for teams that need custom metrics and calculations
- Works especially well with Google Ads and GA4 data
Cons
- Requires manual setup; nothing is pre-built for ecommerce out of the box
- No native ecommerce integrations, so connecting Shopify or WooCommerce requires a third-party connector
- Steeper learning curve than purpose-built dashboard tools
Common Reporting Challenges Ecommerce Brands Face
As reporting becomes more complex, most ecommerce businesses run into a few common challenges like:
Inconsistent Metrics Across Platforms
Have you ever noticed that the same metric shows different numbers depending on where you look?
That's because platforms like Shopify, Meta Ads, and Google Analytics use different attribution models and calculation methods. As a result, teams often spend valuable time trying to reconcile data instead of acting on it.
Data Silos
Most ecommerce brands rely on a growing stack of tools, from ecommerce platforms and ad networks to email marketing software, marketplaces, inventory systems, and payment providers.
When data stays trapped inside each platform, it's difficult to understand how different parts of the business work together and influence overall performance.
Limited Visibility Into Profitability
Revenue is important, but it doesn't tell the whole story.
Many built-in reporting tools focus heavily on sales and marketing metrics while leaving out key costs such as product expenses, shipping fees, transaction costs, refunds, and advertising spend. Without profitability reporting, it's difficult to know which products, campaigns, or channels are actually driving profit.
Manual Reporting Processes
Many ecommerce teams still spend hours exporting CSV files and updating spreadsheets every week.
While that may work at a smaller scale, it quickly becomes inefficient as the business grows. Manual reporting takes time, increases the risk of errors, and makes it harder to maintain accurate, up-to-date insights.
Essential Ecommerce Metrics and KPIs You Should Track
The metrics that matter most are revenue, profitability, customer economics, marketing performance, and inventory health, tracked together rather than in isolation.
Metrics | What It Tells You |
|---|---|
Total sales before discounts, refunds, and returns; shows top-line growth | |
Real revenue after deductions; closer to actual business performance | |
Sales by channel | Which platforms (Shopify, Meta, Google, TikTok) drive revenue concentration or diversification |
Sales by product/category | Identifies winning products and revenue drivers for scaling decisions |
Revenue after COGS; shows baseline product profitability | |
True bottom-line profit after all costs; the most important business KPI | |
Efficiency of turning revenue into profit; key for long-term sustainability | |
Core product cost; impacts pricing and margin strategy | |
Fulfillment efficiency and logistics burden on margins | |
Transaction fees | Hidden cost from payment gateways affecting net profitability |
Cost to acquire each customer; determines scalability of ads | |
Total revenue per customer over time; defines long-term growth potential | |
Spending behavior per order; impacts revenue efficiency | |
Repeat purchase rate | Customer retention strength and brand loyalty |
Store efficiency in turning traffic into buyers | |
Ad effectiveness; must be evaluated alongside profit, not revenue alone | |
Cart abandonment rate | Friction in checkout funnel and lost revenue opportunities |
Product quality or expectation mismatch indicator |
While the table covers all the key ecommerce KPIs, daily decision-making doesn’t require all of them. In practice, you just need to focus on just five metrics each day: net profit, net revenue, conversion rate, CAC, and ROAS, everything else becomes secondary detail.
How to Choose the Right Ecommerce Reporting Tool
Choosing the right tool comes down to six factors: your core questions, platform compatibility, integration depth, ease of use, pricing, and whether profitability is actually covered.
- Start with the question you’re trying to answer: Don’t start with features, start with the problem. If you care about true profitability after ads and costs, a profit-focused tool like TrueProfit makes more sense. If you’re focused on marketing performance, tools like Triple Whale or GA4 may fit better.
- Make sure it fits your tech stack: A reporting tool is only useful if it connects with the platforms you already use. The fewer manual exports and workarounds, the more reliable your data.
- Look beyond the number of integrations: More integrations don’t always mean better data. Check what’s actually being synced, store, ads, payments, and shipping data matter more than quantity.
- Consider setup time: Some tools work out of the box, while others require heavy customization. Choose based on how much time you want to spend building dashboards.
- Don’t focus only on today’s price: Pricing often scales with order volume, so consider long-term cost instead of just the entry price.
- Prioritize net profit, not just revenue: Revenue shows sales, but net profit shows reality. The best tools calculate profit after COGS, shipping, fees, and ad spend, giving you a true view of performance.
Final Thoughts
The best ecommerce reporting tool isn't necessarily the one with the most dashboards or integrations. It's the one that helps you understand what's happening in your business and make better decisions with less manual work.
As ecommerce grows more complex, sales data, ad performance, customer behavior, and operational costs often become scattered across multiple platforms. A good reporting setup brings those numbers together and turns them into a consistent, reliable view of performance.


Harry Chu is the Founder of TrueProfit, a net profit tracking solution designed to help Shopify merchants gain real-time insights into their actual profits. With 11+ years of experience in eCommerce and technology, his expertise in profit analytics, cost tracking, and data-driven decision-making has made him a trusted voice for thousands of Shopify merchants.