




11 Best Ecommerce Analytics Dashboards Worth Using in 2026


Table of Contents
A good ecommerce analytics dashboard brings your most important metrics into one place, helping you move beyond spreadsheets and disconnected reports. From profitability and marketing performance to customer behavior and growth trends, the right dashboard gives you the visibility needed to scale with confidence.
In this guide, I'll compare 11 of the best ecommerce analytics dashboards for 2026, including their key features, pricing, pros and cons, and the types of businesses they're best suited for.
In this blog:
What Is an Ecommerce Analytics Dashboard?
An ecommerce analytics dashboard is a centralized, visual reporting tool that automatically aggregates and displays your online business’s most critical metrics. It pulls raw data from platforms like Shopify, Google Analytics 4 (GA4), Meta Ads, and inventory systems, translating them into easy-to-read charts and graphs.
Beyond simple reporting, it helps you analyze your store’s performance, identify trends, and understand the key drivers behind revenue, conversion rate, and profitability.
Dashboards eliminate the need to manually export and merge spreadsheets, giving you a real-time, 360-degree view of your store’s health.
Why Every Ecommerce Store Needs an Analytics Dashboard
Here's why it has become an essential part of running a modern ecommerce business:
- Unified view of ecommerce performance An analytics dashboard brings together sales, marketing, customer, and operational data from multiple platforms, giving a single source of truth and real-time visibility into key KPIs like revenue, orders, conversion rate, CAC, ROAS, and net profit.
- Faster insights, trend detection, and early issue spotting It helps you quickly identify what’s working and what’s not, spotting top products, winning channels, seasonal trends, and emerging customer behavior.
- Smarter, profit-driven decision making and team alignment By connecting all data sources, it reveals what actually drives profitability beyond revenue and helps teams make faster, data-driven decisions around ads, pricing, product strategy, inventory, and customer retention, while keeping everyone aligned on the same metrics.
Want to dive deeper into ecommerce analytics? Check out our complete guide to learn how to collect, analyze, and act on your store's data more effectively.

Analytics Tools vs Reporting Tools: What’s Difference?
It’s easy to confuse analytics tools with reporting tools, but they actually solve very different problems in data analysis and decision-making. I’ll help you clear that up below.
Aspect | Reporting Tools | Analytics Tools |
|---|---|---|
Primary role | Present structured data for monitoring | Enable exploration and analysis of data to generate insights |
Purpose | Track performance and summarize KPIs | Understand performance drivers and support decision-making |
Core question | “What happened?” | “Why did it happen?” and “What is likely to happen next?” |
Data handling | Aggregates, organizes, and visualizes predefined metrics | Enables slicing, filtering, segmentation, and deeper data exploration |
Analysis capability | Limited to predefined reports and dashboards | Supports ad-hoc analysis, cohort analysis, attribution, and trend discovery |
Decision value | Helps monitor performance | Helps optimize and improve performance |
Example | “Revenue increased 20% this month” | “Revenue increased because Meta Ads drove higher AOV customers from retargeting campaigns” |
The key difference is the level of depth in how data is used. Reporting tools focus on summarizing what has already happened using predefined metrics and dashboards. Analytics tools go a step further by helping you understand why those changes happened through deeper analysis like segmentation, funnels, and attribution.
Common Types of Ecommerce Analytics Dashboards
To make sense of all that data, ecommerce analytics dashboards typically organize information into separate dashboards. Each one focuses on a different aspect of your business. Here are the five most common examples.
1. Marketing Dashboard
A marketing dashboard gives you a single place to monitor performance across all your acquisition channels. Instead of jumping between ad platforms and analytics tools, you can see campaign, traffic, conversion, and attribution data in one view.
For ecommerce businesses, it's often the primary dashboard for measuring marketing effectiveness, optimizing ad spend, and identifying which channels generate the strongest return on investment.
2. Sales Performance Dashboard
A sales performance dashboard provides a real-time view of how your store is performing. It organizes revenue and sales data by product, sales channel, location, or time period, making it easier to spot top-performing products, track trends, and identify areas where growth may be slowing.
3. Customer Insights Dashboard
A customer insights dashboard helps you better understand customer behavior over time. By tracking metrics such as purchase patterns, retention, and customer lifetime value, it provides the insights needed to strengthen loyalty and increase long-term revenue.
4. Operations & Fulfillment Dashboard
An operations and fulfillment dashboard focuses on the metrics behind inventory management and order fulfillment. It helps you monitor how efficiently products move from warehouse to customer while highlighting potential bottlenecks before they impact the customer experience.
5. Executive Dashboard
An executive dashboard combines the most important KPIs from across the business into a single high-level view. Rather than focusing on one area, it brings together marketing, sales, customer, operations, and financial data so you can quickly assess overall business performance and make informed strategic decisions.
11 Ecommerce Analytics Dashboard Tools to Track Your Most Important KPIs
Of course, knowing which KPIs to focus on is only useful if you can track them accurately. That's where the right analytics dashboard makes a difference, helping you turn numbers into insights and insights into action. Here’s is a quick comparison:
Tool | Key Feature | Pricing |
|---|---|---|
TrueProfit | Net profit analytics for Shopify | 14-day free trial (paid plans start at $35/month) |
Triple Whale | Marketing attribution & AI insights | Free (paid plans from $219/month) |
Google Looker Studio | Free custom dashboards | Free |
Databox | KPI dashboards & team reporting | Free (paid plans from $79/month) |
Geckoboard | Real-time KPI dashboards for teams | Starts at $149/month |
Coupler.io | Automated data syncing | Free (paid plans from $32/month) |
Microsoft Power BI | Enterprise BI & advanced reporting | Free (paid plans from $14/user/month) |
Polar Analytics | Marketing analytics for DTC brands | Custom pricing |
Glew.io | Omnichannel ecommerce reporting | Custom pricing |
Shopify Analytics | Built-in Shopify reporting | Included with Shopify plans |
Google Analytics 4 (GA4) | Website & customer behavior analytics | Free |
1. TrueProfit
TrueProfit is the #1 net profit analytics platform for Shopify merchants.
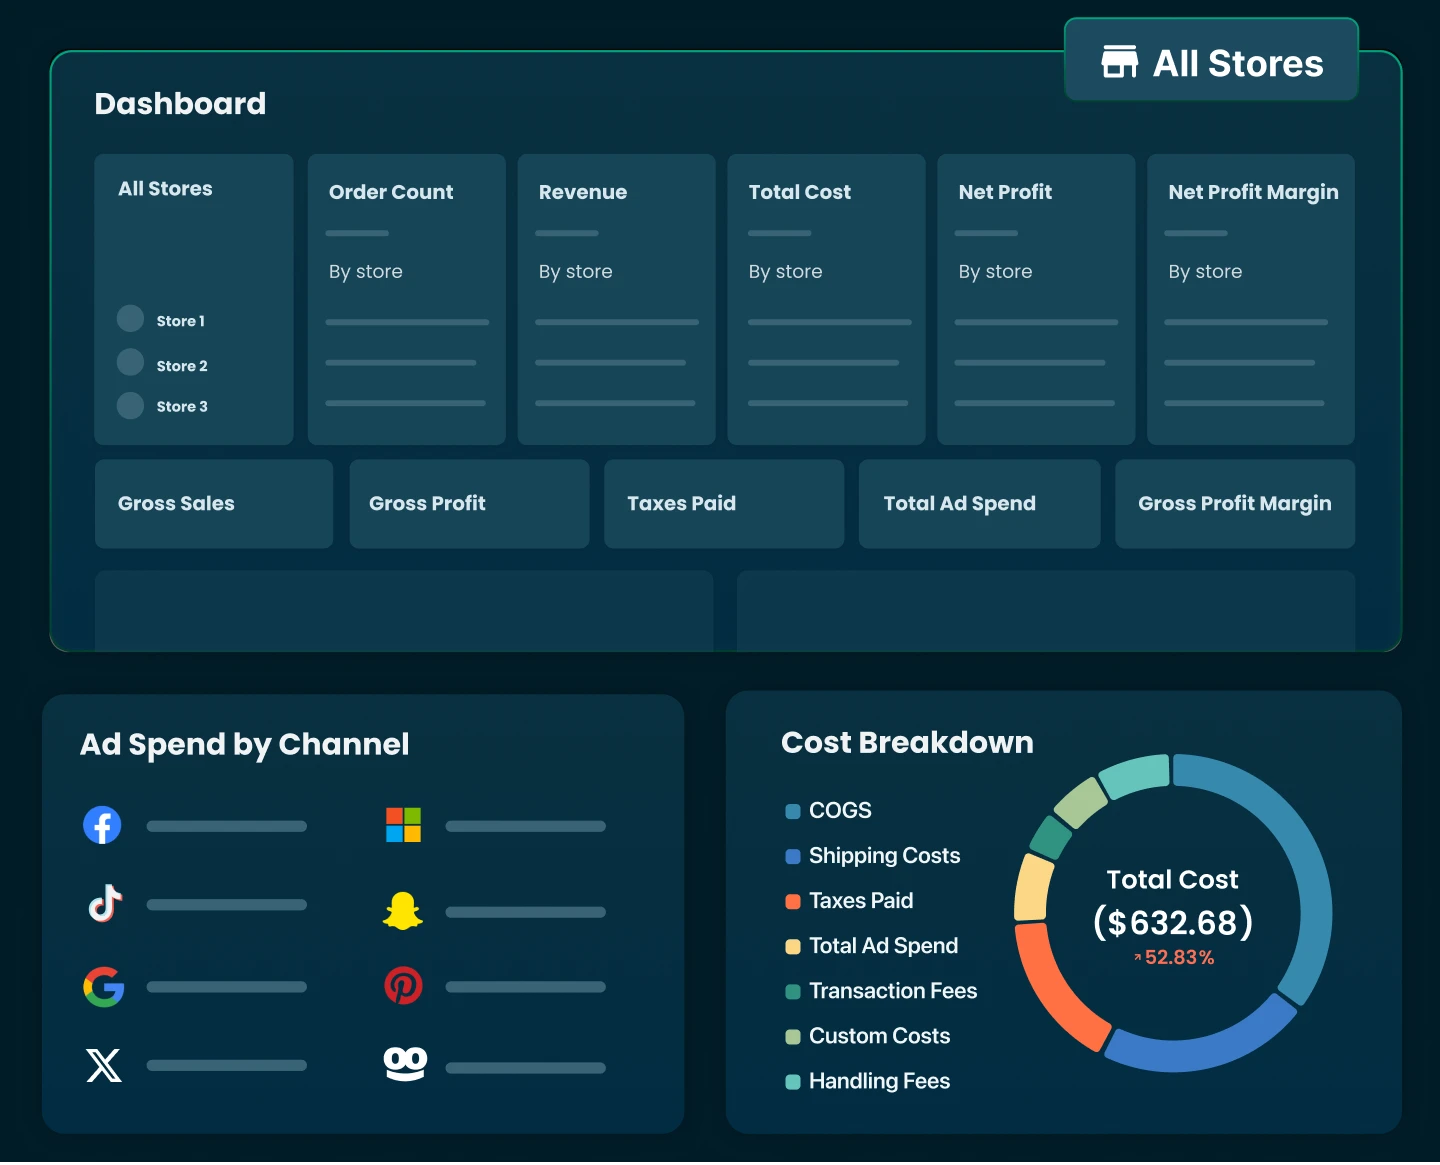
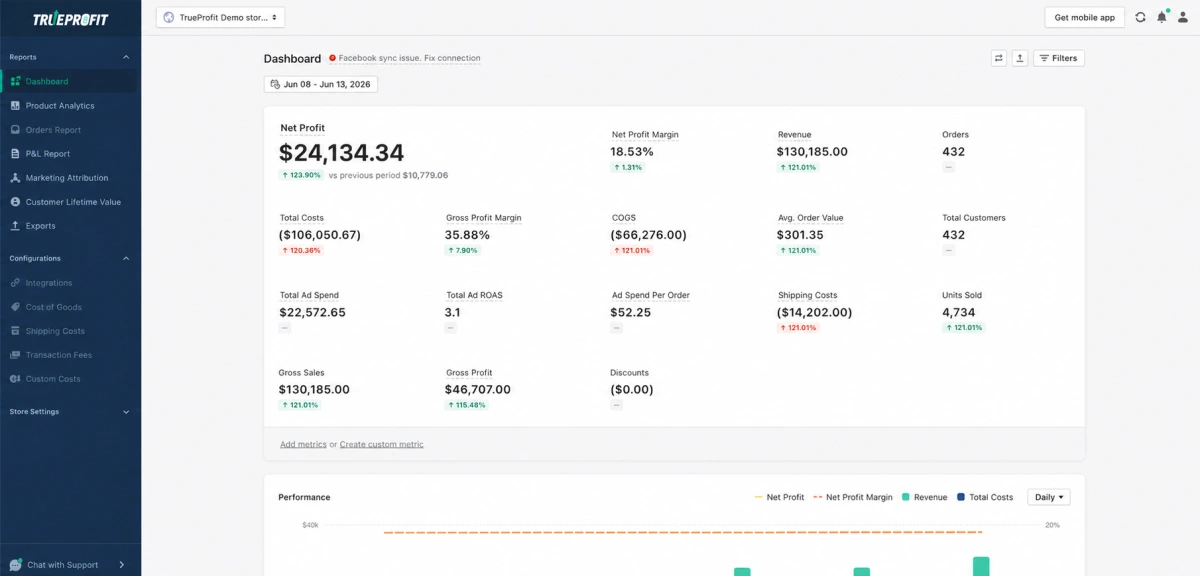
It pulls all your store’s ins and outs into one dashboard, giving you a real-time clarity on your actual net profit. Store-wide, by product, by marketing channel: TrueProfit shows exactly what's driving profitability, and what's quietly killing it.

Why It's Great for Ecommerce Stores
Many merchants still rely on spreadsheets and manual calculations to combine revenue, ad spend, product costs, shipping expenses, and fees. The process is time-consuming, prone to errors, and often leaves store owners working with outdated numbers. By the time the reports are ready, the business opportunities may have been missed.
TrueProfit solves this by bringing the key drivers of profitability into a single dashboard with near real-time visibility. Instead of spending hours reconciling data across multiple platforms, merchants can instantly understand how their store is performing, which products generate the most profit, and whether their marketing spend is actually contributing to the bottom line.
Key Features
- Real-time profit dashboard: Shows net profit, gross margin, and true profit per order/product as orders come in, not at the end of the month.
- Automatic cost sync: Pulls COGS, Shopify transaction fees, and shipping costs without manual input, and syncs ad spend from Meta, Google, TikTok, Bing, and Snapchat.
- Product-level analytics: See which products and variants are actually profitable, not just which ones sell the most.
- P&L report: A full profit and loss statement covering any date range, useful for reviewing business health month over month.
- Marketing attribution: Attribute revenue and net profit to specific ad campaigns and channels, not just platform-reported ROAS.
- Customer Lifetime Value tracking: Monitor cohort-level CLV to understand which acquisition channels bring the most profitable long-term customers.
- TrueProfit MCP: Connects TrueProfit's data to AI tools like Claude and ChatGPT so you can ask questions about your store's profit in real time.
Pros
- No technical setup required. Works natively with Shopify out of the box.
- Advanced COGS tracking system that accurately handles complex product costs for precise margin calculation
- Wide range of integrations with ads, shipping, payments, dropshipping, and POD tools for automated data sync
- Custom cost and formula support for flexible, business-specific margin calculations
- AI-ready data layer that connects with AI tools for real-time dashboards and natural language profit insights
- 5.0 Shopify App Store rating across hundreds of reviews, with consistent praise for accuracy and support quality.
Cons
- Built specifically for Shopify, so not useful if you sell on other platforms like WooCommerce or BigCommerce.
- Higher order volumes require higher-tier plans, so costs scale as you grow.
- Custom reporting and advanced ad sync rules are gated to higher plans.
Pricing
TrueProfit offers flexible pricing plans that scale with your store’s order volume. Plans start at $35/month. Every plan comes with a 14-day free trial.
Best For
Shopify sellers at any stage who want to see their actual net profit without building spreadsheets.
User Reviews
TrueProfit consistently earns 5.0 stars on the Shopify App Store with over 780 reviews.
According to Carholics, store owner: “I have been using TrueProfit for over a year at this point and I have to admit that not having a profit calculator is biggest mistake a shop can do. You have to know where every dollar or euro goes to. TrueProfit goes very deep in to making sure you track every cent with complex tracking and I loved that Durra helped me setup all that up. 5/5 tool.”
2. Triple Whale
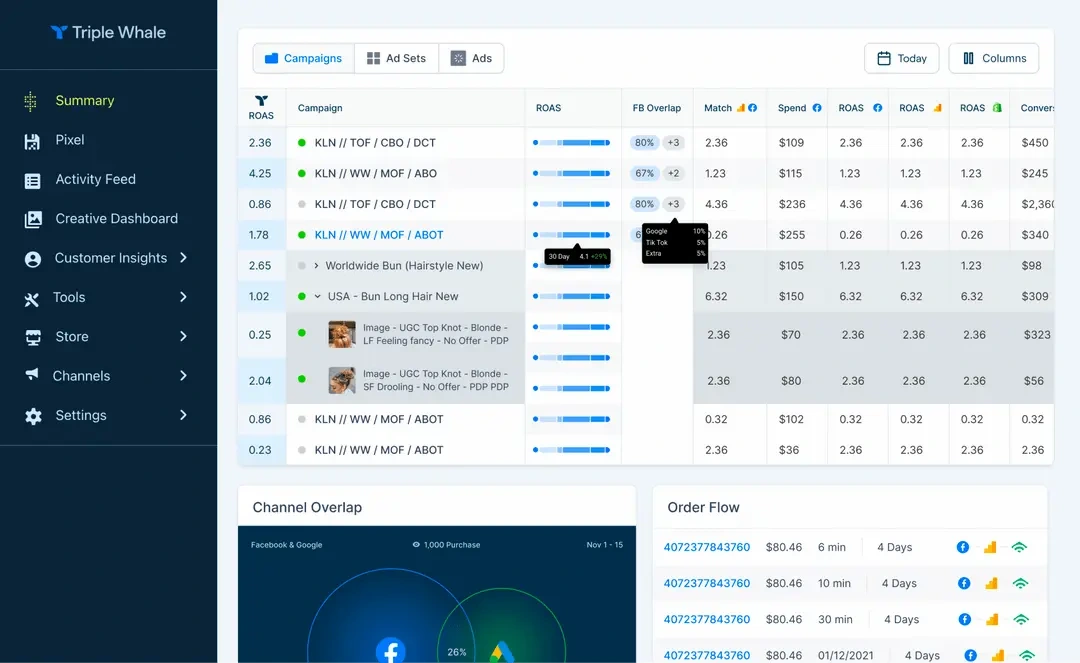
Triple Whale is an AI-powered ecommerce intelligence platform used by over 60,000 brands. It started as a Shopify attribution tool and has expanded into a full analytics operating system with Moby, its AI operator, at the center. It is built primarily for DTC brands with serious paid media budgets.
Why It's Great for Ecommerce Stores
When you are running ads across Meta, Google, TikTok, and influencer channels simultaneously, platform-reported ROAS from each one will never add up to a coherent picture. Triple Whale stitches those data streams together using first-party pixel data and multi-touch attribution, giving you a single view of where your marketing dollars are actually working.
Key Features
- First-party pixel: Tracks customer journeys beyond what platform cookies capture, especially useful as browser-side tracking degrades.
- Multi-touch attribution: Assigns credit across the full customer journey rather than giving everything to the last click.
- Moby AI operator: Goes beyond answering questions, it can actually take actions in your ad accounts, build campaigns, and generate landing pages based on your real data.
- Creative analytics: Measures ad creative performance so you know which hooks, formats, and visuals drive profit, not just clicks.
- Cohort analysis: Groups customers by acquisition cohort to show which channels build the most valuable long-term buyers.
- Real-time mobile dashboard: A mobile app that shows daily P&L, ad spend pacing, and order data with push notifications for revenue milestones.
Pros
- The most complete attribution picture available for Shopify DTC brands running multi-channel paid media.
- Moby AI differentiates it meaningfully from passive analytics tools by actually doing work, not just reporting.
- Strong community and agency ecosystem around the platform.
- Integrates with Klaviyo, Slack, Google Sheets, Snowflake, and more.
Cons
- Does not natively calculate true net profit. The focus is attribution and marketing efficiency, not P&L.
- Pricing is tied to GMV, so costs scale quickly as revenue grows. A brand at $1M GMV pays significantly less than one at $5M on the same plan.
- Revenue-tiered pricing can jump after a strong Q4, which catches some users off guard.
- SKU-level profitability analysis is limited on most plans.
Pricing
Free plan available. Paid plans start at $219/month and scale with store revenue.
Best For
DTC Shopify brands spending $20K+ per month on paid ads who need accurate multi-channel attribution and want AI that can act on data, not just surface it.
User Reviews
According to Jack, store owner: “Akil and the team at Triple Whale have been easy to deal with and the software is a real bonus to our business. We use it daily to track our performance and it brings everything together for us as a business! Thanks heaps.”
3. Google Looker Studio
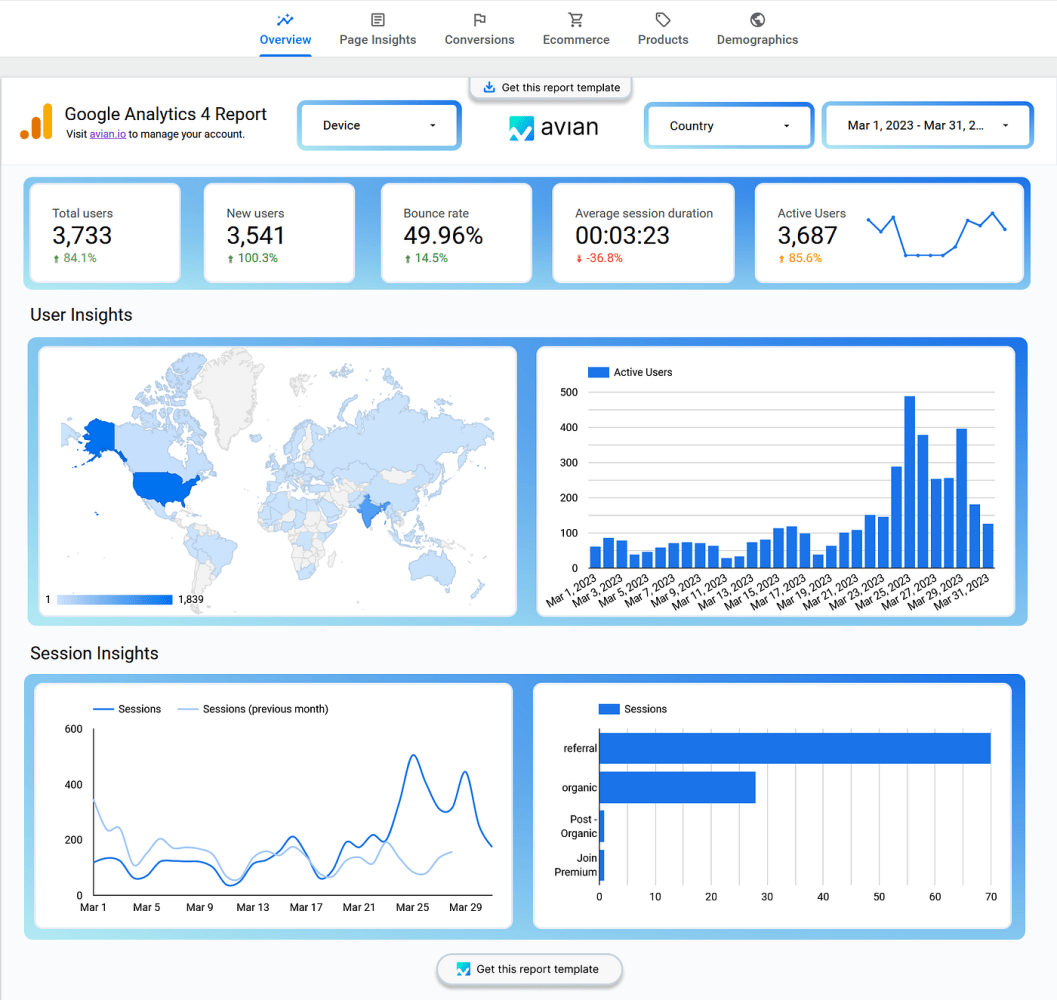
Looker Studio (formerly Google Data Studio) is a free data visualization and reporting tool from Google. It connects to Google's ecosystem natively like GA4, Google Ads, Search Console, BigQuery, Google Sheets and through third-party connectors to virtually everything else. For ecommerce stores that live primarily inside the Google ecosystem, it is an extremely capable free tool.
Why It's Great for Ecommerce Stores
Most ecommerce reporting requires pulling from multiple sources: traffic from GA4, ad performance from Google Ads, and store data from Shopify. Looker Studio handles this without charging for the tool itself. You build the dashboard you want with a drag-and-drop interface, set it to auto-refresh, and share it with your team via link. The real cost of most setups is zero, especially if your core channels are Google Ads and organic search.
Key Features
- Native Google connectors: GA4, Google Ads, Search Console, BigQuery, and Sheets connect in seconds with no setup cost.
- Drag-and-drop builder: No SQL or coding required for most use cases. Charts, scorecards, and tables are built visually.
- Template gallery: Hundreds of free community-built ecommerce templates covering GA4 traffic, Google Ads performance, and Shopify data via third-party connectors.
- Real-time collaboration: Multiple users can edit and view reports simultaneously, similar to Google Docs.
- Unlimited reports: No limit on dashboards, pages, or data sources under the free tier.
- Looker Studio Pro: A paid upgrade at $9/user/project/month that adds team ownership, IAM/SSO compliance, Gemini AI, and up to 200 scheduled deliveries.
Pros
- Completely free for Google ecosystem data with unlimited reports and users.
- Covers the majority of what most Shopify stores need from a traffic and marketing perspective without spending anything.
- Highly customizable. If you need a chart that does not exist in another tool, you can usually build it here.
- A massive library of free templates eliminates most of the setup work.
Cons
- Connecting non-Google data (Meta Ads, Shopify, TikTok) requires paid third-party connectors.
- Not intuitive for non-technical users who want a plug-and-play experience.
Pricing
Free plan available. Paid plans start at $9/user/month.
Best For
Stores already invested in the Google ecosystem (Google Ads + GA4) that want a flexible, free reporting layer.
User Reviews
According to Reddit user (rddevv): “Looker Studio is great, essentially for a free tool. I build marketing and ecommerce reports and they generally prefer it over other tools. I generally sync data to Sheets as you can do some processing before it hits Looker.”
4. Databox
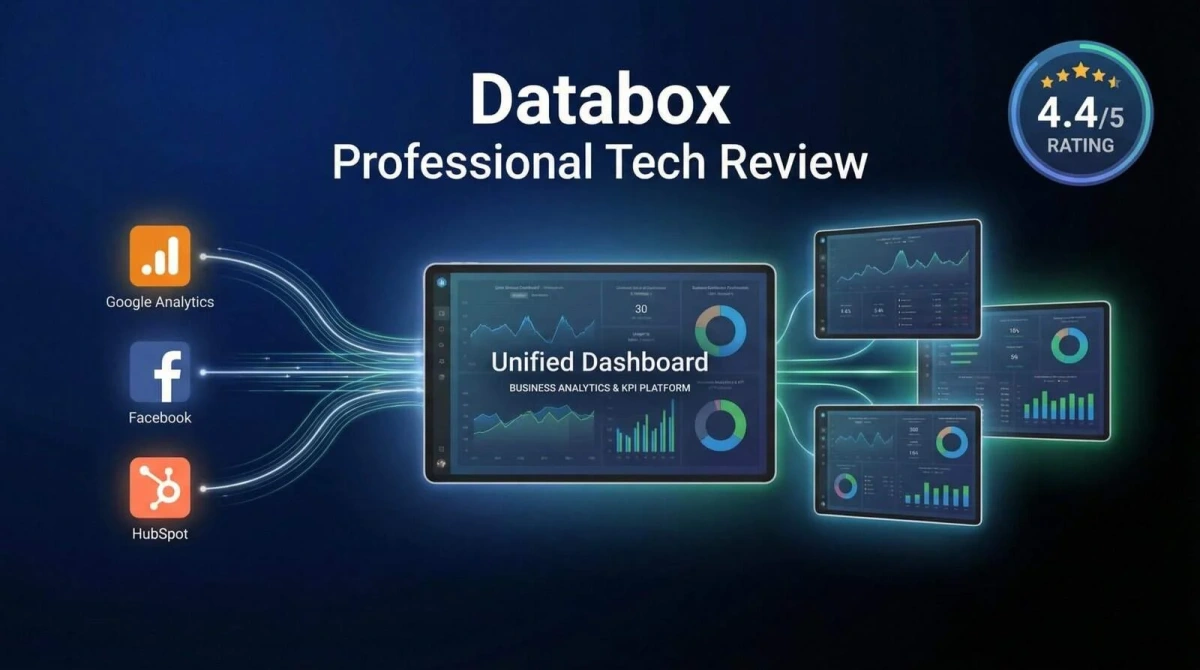
Source: AIToolShop
Databox is a business intelligence (BI) and performance reporting platform that helps businesses collect, visualize, and monitor data from multiple tools in one place. Instead of checking Shopify, Google Analytics, Meta Ads, Google Ads, Klaviyo, and other platforms separately, Databox automatically pulls data into customizable dashboards and KPI reports, making it easier to track business performance.
Why It's Great for Ecommerce Stores
Databox is a great fit for ecommerce teams that want to monitor performance across multiple platforms without building custom dashboards from scratch. With pre-built templates for Shopify, Google Ads, Meta Ads, Klaviyo, GA4, and more, you can quickly centralize key metrics into a single, shareable dashboard.
Its unlimited users on every plan also make it easy for marketing, operations, and leadership teams to stay aligned. That said, Databox is primarily a reporting and BI tool rather than a dedicated ecommerce analytics platform.
Key Features
- 130+ native integrations: Shopify, GA4, Meta Ads, Google Ads, Klaviyo, HubSpot, TikTok, and more, all with pre-built metric blocks.
- AI-powered answers: Ask business questions in plain language and get visual responses with context and explanation, without writing queries.
- Pre-built KPI templates: Hundreds of ready-made dashboards organized by use case, so most stores can start with an existing layout rather than building from zero.
- Automated reports: Scheduled email and Slack delivery of key KPIs on daily, weekly, or monthly cadences.
- Goal tracking: Set targets for each metric and track progress toward them with visual indicators.
- Mobile app: Full dashboard access on iOS and Android.
Pros
- Unlimited users on all paid plans, which makes team-wide visibility affordable.
- Pre-built templates dramatically reduce setup time compared to building from scratch in Looker Studio.
- AI assistant handles plain-language questions about performance, useful for non-technical team members.
- Works well for agencies managing multiple client dashboards from a single account.
- Strong integration breadth covering most ecommerce marketing and operations tools.
Cons
- Pricing is driven by the number of data sources, not users. Each additional source beyond the plan's included count costs extra, which can push costs higher than the base price suggests.
- Some users report customization is harder than expected after the initial setup, particularly for complex metric calculations.
- Customer support has received mixed reviews, with some users reporting slow response times.
- No native profit tracking. Like most tools here, it shows revenue and ROAS rather than net profit.
Pricing
Free plan available. Pricing starts at around $79/mo for Analyst plan.
Best For
Ecommerce marketing teams and agencies managing multi-channel campaigns who want structured KPI dashboards with minimal setup, unlimited team access, and automated reporting.
User Reviews
According to Rohan Thotayan: “Great Team, they really are customer centric and always there to support us. Great platform for Marketing dashboard at best price. I thinking they are unique with a perfect tool and customer friendly approach.”
5. Geckoboard
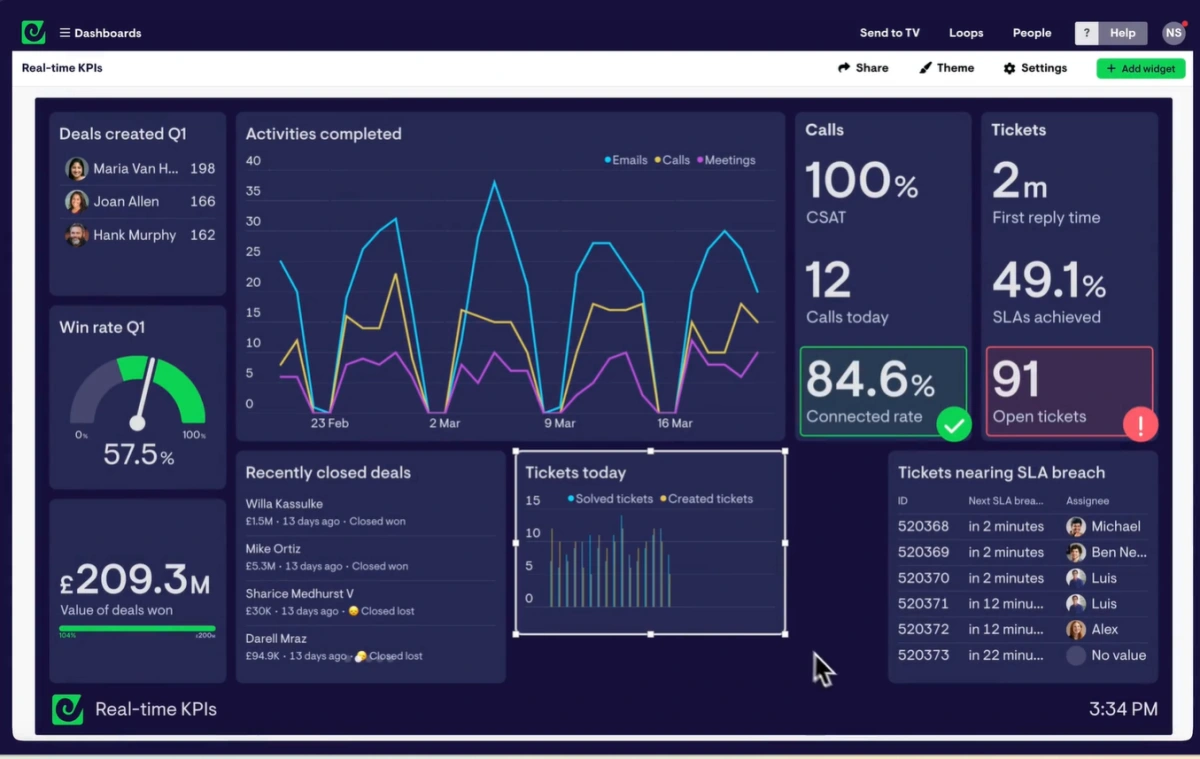
Geckoboard specializes in real-time KPI dashboards designed to be displayed on office screens, TV walls, and shared team views. It is intentionally simple. The value proposition is not depth of analysis but visibility: key numbers, visible to the whole team, always current. It connects to 90+ tools including Shopify, GA4, Facebook Ads, and Zendesk.
Why It's Great for Ecommerce Stores
If you run a team and want everyone to see the same numbers at all times, Geckoboard solves that problem cleanly. It is less about deep analysis and more about real-time awareness. An operations team can see today's orders and unfulfilled count. A marketing team can watch ROAS and spend pacing. A customer support team can monitor ticket volume. All on the same screen, always updated. The Shopify connection is native and displays gross sales, total sales, AOV, orders, and sales by channel.
Key Features
- TV and wall display support: Designed explicitly for shared screens. Dashboards refresh automatically and display cleanly at large sizes without any user interaction.
- Shopify native connection: Pulls key Shopify metrics directly, including daily orders, revenue, AOV, unfulfilled orders, and sales by channel. Supports multiple stores.
- 90+ integrations: Covers most marketing, CRM, support, and ecommerce platforms.
- Snapshot sharing: Send scheduled dashboard screenshots via Slack, email, or direct link.
- Mobile dashboards: Access the same view on iOS and Android for remote or travel situations.
Pros
- The simplest setup of any paid tool on this list. Most teams are live within an hour.
- TV display mode is genuinely useful for office environments where ambient awareness of key metrics drives team focus.
- Supports multiple Shopify stores in one dashboard, useful for merchants managing more than one brand.
- Clean, distraction-free interface that non-technical users can read without training.
- Shopify App Store listing with a 5.0 rating.
Cons
- Limited analytical depth compared to tools like Databox or Looker Studio. It is a visibility tool, not an analysis tool.
- No built-in AI features.
- The integration breadth (90+ tools) is lower than competitors like Databox or Coupler.io.
- No profit tracking capabilities. Displays Shopify revenue metrics only, not net profit.
- Pricing can feel steep relative to feature depth for smaller teams.
Pricing
Geckoboard starts at $149/month. A free trial is available.
Best For
Small to mid-sized ecommerce teams who want always-on KPI visibility for the whole office. Especially useful for operations-focused dashboards and daily team standup reference.
User Reviews
According to Peter L: “This is a wonderful way to share KPIs with your team in a visually-pleasing way. The easiest way to build dashboards that are both meaningful as well as effective.”
6. Coupler.io
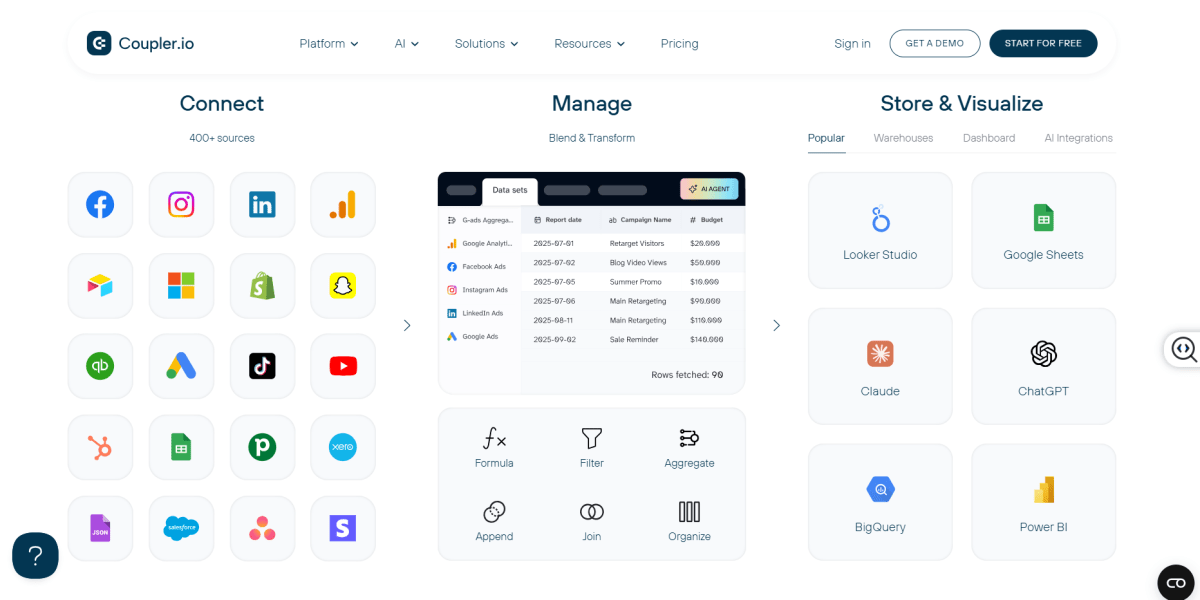
Coupler.io is a no-code data integration platform that pulls data from 400+ sources and pushes it into Google Sheets, Excel, BigQuery, Looker Studio, Power BI, and more. It is not a dashboard tool by itself. It is the plumbing that makes your spreadsheet or BI tool automatically stay current without manual exports.
Why It's Great for Ecommerce Stores
Many Shopify stores already have a reporting setup they like in Google Sheets or Looker Studio. The problem is keeping it updated. Manual CSV exports every Monday morning are tedious and prone to error. Coupler.io automates that flow: your Shopify data, Google Ads data, Klaviyo data, and Meta Ads data flow into your chosen destination on a schedule you define, refreshing as frequently as every 15 minutes on higher plans. It also connects to AI tools including Claude and ChatGPT for automated data analysis.
Key Features
- 400+ source connectors: Shopify, GA4, Meta Ads, Google Ads, TikTok Ads, Klaviyo, and hundreds of others.
- Flexible destinations: Push data to Google Sheets, Excel, BigQuery, Looker Studio, Power BI, Tableau, Redshift, and AI tools.
- Pre-built Shopify templates: Ready-made dashboard templates for Looker Studio and Google Sheets that activate once data is flowing.
- Scheduled refresh: Set automated data refresh from daily (Starter) down to every 15 minutes on higher plans.
- Data transformation: Basic transformation and formula application before data lands in the destination.
- AI integrations: Native connections to Claude, ChatGPT, Perplexity, and Gemini for automated analysis on your synced data.
Pros
- Solves the most common analytics pain point for spreadsheet-based stores: stale data.
- Broad source library means most Shopify merchants can connect everything they need without workarounds.
- Pre-built Shopify templates get you from connection to working dashboard quickly.
- Annual billing offers a 25% discount, making it cost-effective for teams with consistent data needs.
- Free tier available for testing before committing.
Cons
- Pricing is based on the number of data connections (not users), which can escalate quickly for stores pulling from many sources or accounts. Each Google Ads account counts as a separate connection.
- The free plan is very limited: one source, one destination, manual refresh only, and a 100-row cap per run, which most real-world data sets exceed immediately.
- The jump from Starter ($32/month) to Active ($132/month) is steep with few mid-tier options.
- Not a dashboard itself. You still need to build or maintain your reporting layer separately.
Pricing
Coupler.io offers a free plan, along with paid plans that start at $32/month.
Best For
Ecommerce stores that already have a preferred reporting environment (Sheets, Looker Studio, Power BI) and want to automate data syncing without writing API code.
User Reviews
According to Propeller Aero: “We had a niche issue where we wanted to invoice customers in Xero who had placed orders but not paid for them in Shopify. This connection was not available as a direct integration so we were able to use Coupler to obtain all the Shopify data and push that to Xero as an invoice really easily. Saved us a lot of manual time”.
7. Microsoft Power BI
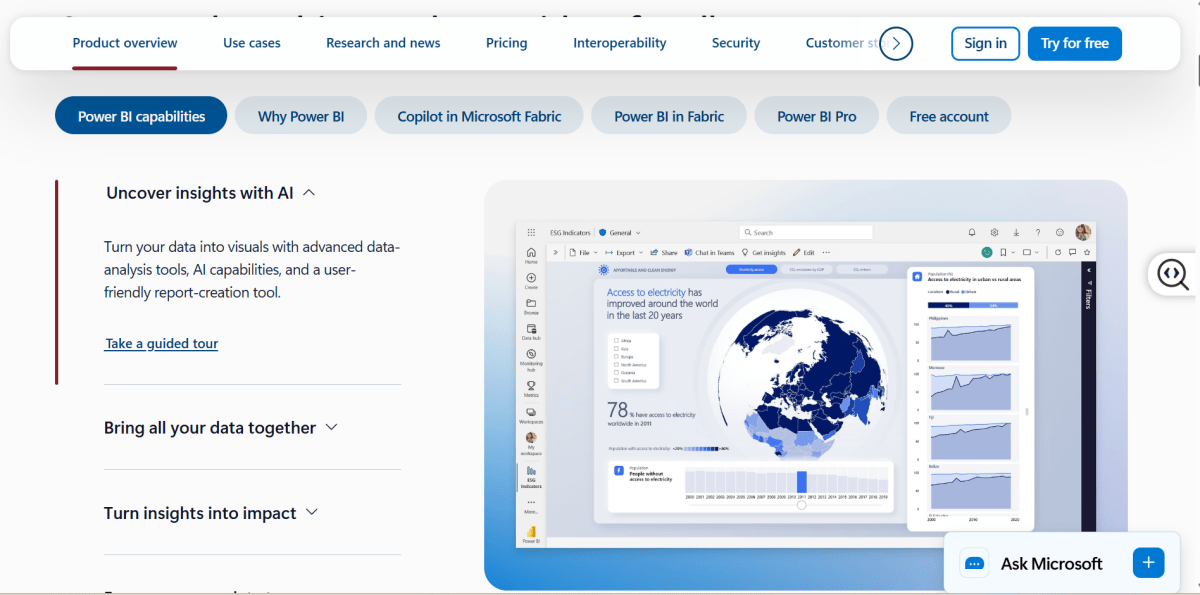
Power BI is Microsoft's enterprise business intelligence platform. It connects to hundreds of data sources, offers advanced data modeling through DAX and Power Query, and produces highly customizable interactive dashboards and reports. It sits in the same category as Tableau but with a stronger Microsoft ecosystem fit and a lower per-user entry price.
Why It's Great for Ecommerce Stores
Power BI makes the most sense for mid-to-large ecommerce operations that need sophisticated reporting across multiple data sources and have at least one person comfortable with data modeling. If you are pulling from Shopify, multiple ad platforms, a 3PL, and your accounting software simultaneously, Power BI can unify all of it in ways simpler tools cannot. The AppSource marketplace also has community-built ecommerce sales dashboard templates that give a usable starting point without building from scratch.
Key Features
- Advanced data modeling: DAX calculations let you define custom metrics like blended CAC, contribution margin by channel, or LTV-weighted ROAS at a level other tools do not support.
- Power Query for data transformation: Clean, reshape, and join data from multiple sources before it hits your dashboard.
- AppSource ecommerce templates: Community-built templates covering sales trends, product performance, and regional breakdowns, available free.
- Direct Query and Import modes: Choose between live data connections and imported snapshots based on your performance and freshness needs.
- Embedded reporting: Publish dashboards within internal tools or external-facing portals.
- Mobile app: Optimized dashboard access on iOS and Android.
Pros
- The most powerful data modeling capabilities on this list for teams that need custom metric definitions.
- Relatively affordable per-user pricing compared to Tableau at the entry level.
- Seamless integration with the broader Microsoft ecosystem: Excel, Teams, Azure, SharePoint.
- Community template library reduces build time significantly for common ecommerce reporting use cases.
- Scales from small team use to enterprise deployment on the same platform.
Cons
- Requires meaningful technical skill to use well. DAX and Power Query have learning curves that can take weeks to months to master.
- Not a plug-and-play tool. Connecting Shopify requires either Microsoft's native connector, a third-party tool like Coupler.io, or data exports.
- No native profit tracking. Like all BI tools, it shows what you bring to it. You need to bring cost data in and model it correctly.
- Power BI Service (cloud sharing) requires a paid license per user for sharing outside your organization.
Pricing
Power BI offers a free Desktop version for local use, while paid plans start at $14/month for Power BI Pro.
Best For
Mid-market to enterprise ecommerce businesses with in-house data or analytics staff who need sophisticated, multi-source reporting and are already invested in the Microsoft ecosystem.
User Reviews
According to Anil B: “What I like most about Microsoft Power BI is how quickly it turns raw data into clear, interactive visuals. The drag-and-drop interface feels intuitive, even for beginners, yet it still offers powerful analytics for advanced users”.
8. Polar Analytics
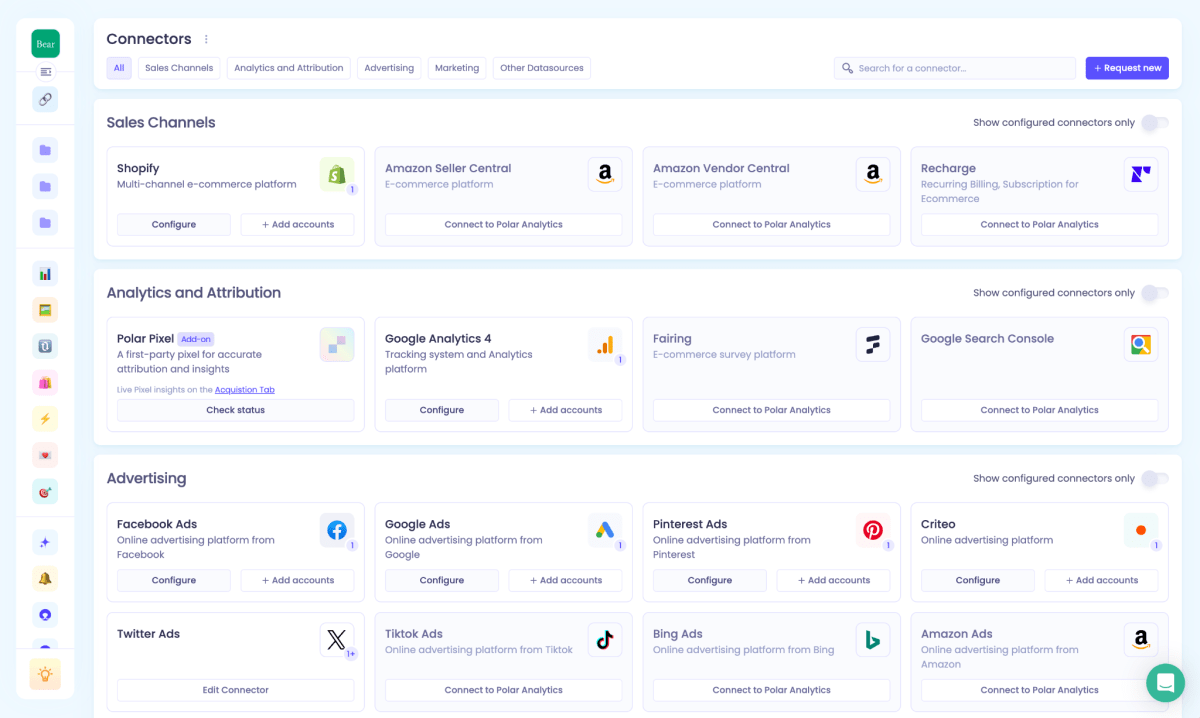
Polar Analytics is a marketing-first ecommerce analytics layer that helps DTC brands unify performance data across ads, sales, and customer behavior, without building a complex data warehouse or relying on a data team.
Instead of focusing deeply on accounting-level profitability or raw BI flexibility, it sits at the execution layer for growth teams, where the goal is simple: understand what’s working in marketing and scale it faster.
Key Features
- Marketing performance hub: Centralizes paid ads, Shopify sales, and retention data into one view
- Pre-built growth metrics: CAC, ROAS, LTV, MER, conversion rate out of the box
- Cross-channel attribution view: Understand performance across Meta, Google, TikTok, and email
- Funnel visibility: Track where users drop off from ad click to purchase
- Custom dashboards (lightweight): Adjust views without heavy BI setup
- Multi-source sync: Connects ecommerce, ads, and analytics tools quickly
Pros
- Very fast to set up compared to traditional BI tools
- Designed specifically for ecommerce owners or marketing teams, not analysts
- Clean dashboards that focus on actionable growth metrics
- Reduces dependency on spreadsheets and manual reporting
- Strong fit for scaling DTC brands
Cons
- Not built for deep financial modeling or profit-level accuracy
- Less flexible than full BI platforms like Power BI or Looker
- Can feel limited for data engineering or advanced custom logic
- Pricing may become expensive for larger data volumes
Pricing
Polar Analytics uses tiered subscription pricing based on store size, data volume, and number of integrations. Entry-level plans typically start in the $300+/month range.
Best For
Ecommerce growth stores and DTC brands that want a fast, marketing-focused analytics layer to optimize ad spend and scale revenue, without building a full BI infrastructure.
User Reviews
According to Susanne Kaufmann: “Great tool to centralise your dispersed data! Brings everything from Shopify to Meta ads into one place. It has revolutionised how we report and helps uncover hidden trends in campaign performance and product performance.”
9. Glew.io
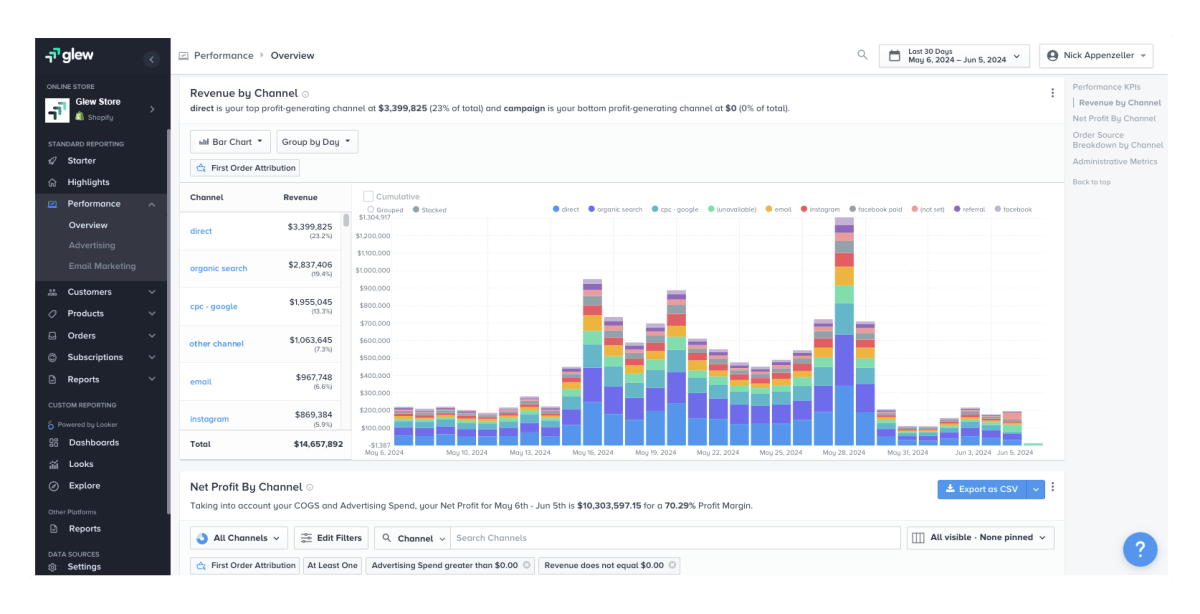
Glew.io brings together data from ecommerce platforms, marketplaces, POS systems, marketing channels, and inventory tools into a centralized reporting platform. Its strength lies in helping merchants uncover trends across customers, products, inventory, and operations through hundreds of pre-built reports and customizable dashboards.
Why It's Great for Ecommerce Stores
As stores grow, reporting becomes more complicated. Sales may come from Shopify, Amazon, retail locations, or wholesale, while inventory and marketing data live in separate systems. Glew.io is designed to connect these data sources so merchants can analyze the business as a whole instead of switching between multiple dashboards.
It goes beyond campaign reporting by helping answer broader operational questions, such as:
- Which customer segments generate the highest lifetime value?
- Which products are tying up inventory without producing enough profit?
- How does inventory turnover affect overall business performance?
- Which sales channels contribute the most sustainable growth?
Key Features
- Multi-channel reporting: Consolidates data from ecommerce stores, marketplaces, POS systems, and marketing platforms.
- Customer analytics: Track customer lifetime value, repeat purchase behavior, segmentation, and retention.
- Inventory intelligence: Monitor inventory turnover, stock levels, sell-through rates, and purchasing trends.
- Product performance reports: Analyze best-selling, slow-moving, and high-value products across channels.
- Executive dashboards: Access pre-built reports covering sales, operations, marketing, and customer performance.
- Custom reporting: Build tailored dashboards and reports for different teams or business goals.
- Forecasting tools: Identify sales trends and support inventory planning with historical performance data.
Pros
- Excellent visibility across multiple business functions, not just marketing
- Strong customer and inventory analytics
- Supports omnichannel retailers with multiple sales platforms
- Large library of ready-to-use ecommerce reports
- Reduces manual reporting across departments
Cons
- Interface can feel overwhelming for smaller businesses
- Initial setup may require more configuration than lightweight analytics tools
- Some advanced features are better suited to mid-sized and enterprise merchants
- Pricing is less accessible for early-stage stores
Pricing
Glew.io offers custom pricing based on your business size, sales volume, integrations, and reporting requirements.
Best For
Mid-sized and enterprise ecommerce brands that sell across multiple channels and need comprehensive reporting for customers, inventory, operations, and sales.
User Reviews
According to Charles P: “Glew.io has been a game-changer for our business intelligence and reporting needs at GoPure Beauty. As the VP of Data + Analytics, I sought a platform that could streamline our data integration across multiple sources while providing insightful reporting and dashboards.”
10. Shopify Analytics
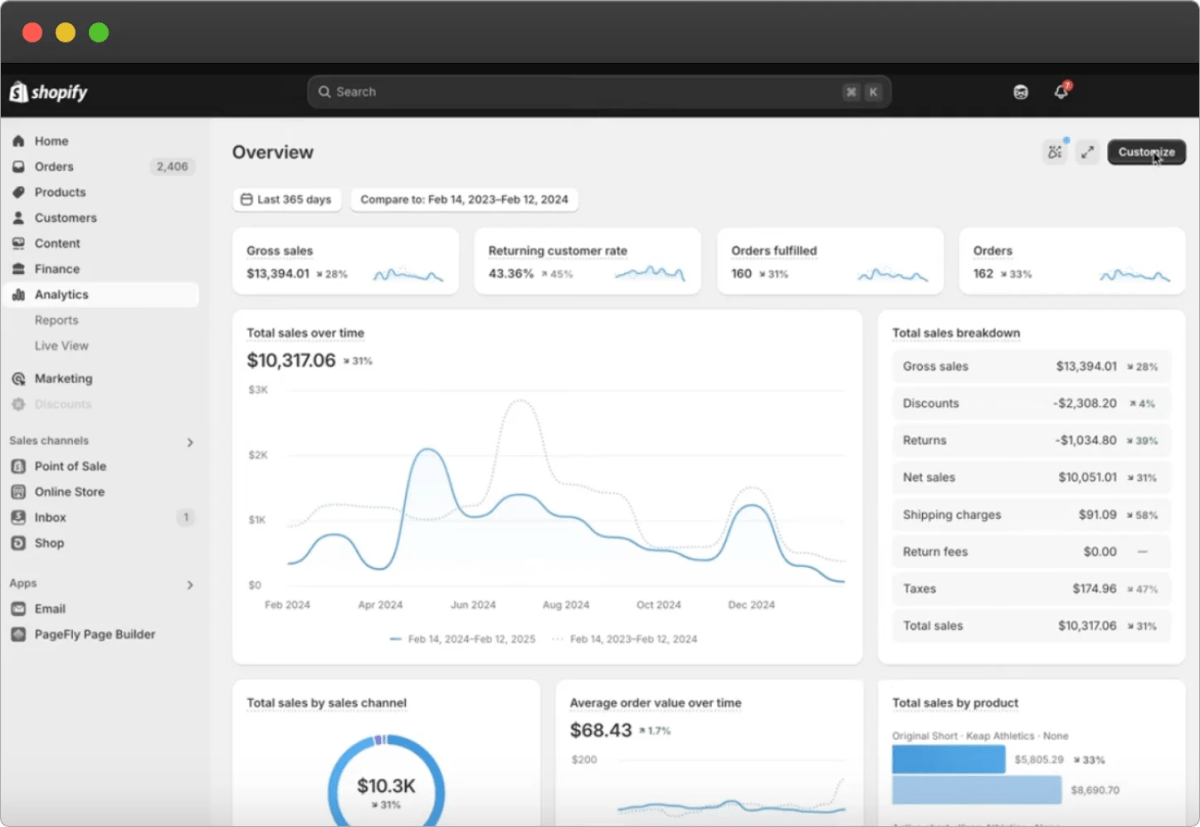
Shopify Analytics is the built-in reporting suite included with every Shopify plan. It tracks sales, orders, traffic, customer behavior, and marketing sources directly inside the Shopify admin. No setup required, no additional cost, no integrations needed for core store data. The 2025 and 2026 updates added a customizable dashboard, RFM customer segmentation, natural language report creation via Sidekick AI, heatmap visualizations, and minute-level event monitoring.
Why It's Great for Ecommerce Stores
For a store in its first year or two, Shopify Analytics is usually enough. It tells you what sold, who bought, where they came from, and how your store performed over any date range. The 2025 updates made it meaningfully better, particularly the RFM segmentation (Champions, Loyal, At Risk, Hibernating customers) and natural language querying, which lets non-technical founders ask plain-English questions and get real answers. It is also the only tool on this list with zero additional cost and zero setup friction.
Key Features
- Customizable home dashboard: Drag-and-drop arrangement of metric cards, with date comparison and filtering.
- RFM customer segmentation: Winter 2025 update. Segment customers by recency, frequency, and monetary value directly inside Shopify.
- Sidekick AI natural language queries: Ask questions in plain English ("What were my top 5 products last month by revenue?") and get answers via ShopifyQL without writing code.
- Live View: Real-time session and order monitoring, useful during launches, flash sales, and BFCM.
- Finance reports: Sales, taxes, payments, and payout reports covering all transactions.
- Inventory reports: Stock levels, sell-through rates, and movement tracking.
- 13-month data window: All plans include up to 13 months of historical data. Longer history requires exporting.
Pros
- Zero cost, zero setup. Works from day one on any Shopify plan.
- Good enough for most stores doing under $50K/month without additional tooling.
- RFM segmentation and Sidekick AI make it genuinely useful for customer analysis, not just sales reporting.
- Integrates natively with all Shopify data, including returns, discounts, and fulfillment status.
- Recent updates added features that previously required third-party tools.
Cons
- No true profit tracking. No COGS, no shipping cost analysis, no true margin visibility.
- No cross-channel attribution. All attribution is last-click only, which under-credits awareness channels like Meta and influencer.
- Custom reports are gated to Advanced ($299/month) and Plus plans. Basic and Shopify plan users get limited report access.
- The 13-month data cap limits long-term trend analysis.
- No web analytics (bounce rate, time on page, scroll depth). You need GA4 for that layer.
Pricing
Shopify Analytics is included free with all Shopify plans. Access to advanced reports (custom report builder, detailed customer analytics) requires the Advanced plan at $299/month or Shopify Plus at $2,300/month. Basic ($29/month) and Shopify ($79/month) plans have meaningful report limitations.
Best For
New stores and stores doing under $50K/month that want zero-setup baseline reporting. Useful as a complementary data source for any store, regardless of what other tools they use, since it holds the ground truth for all Shopify transaction data.
User Reviews
According to VillageHomeF: “It's extremely helpful to me. I don't get a lot of visitors yet most of the US vistors are potential customers looking at products. I examine who comes to the site, from what location, how they were referenced, what was the landing page, etc. to figure out how I can improve my sites.”
11. Google Analytics 4 (GA4)
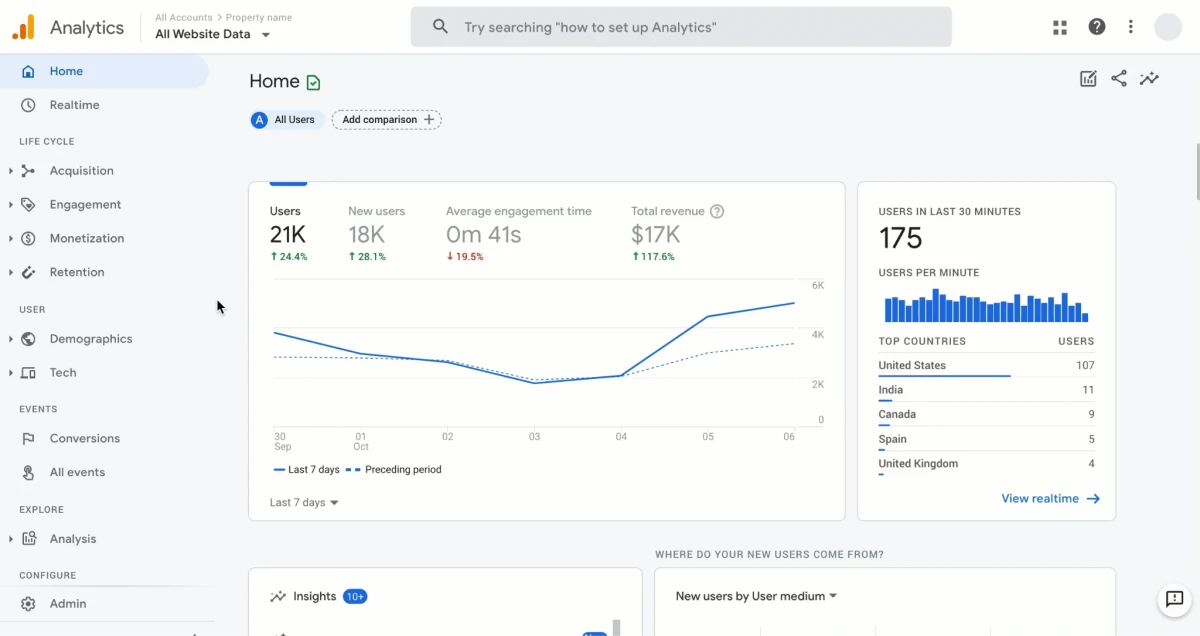
GA4 tracks user activity across websites and mobile apps using an event-based data model, giving merchants a more complete picture of the customer journey. It measures everything from traffic sources and page engagement to checkout behavior and purchases, helping businesses identify where users drop off and which marketing efforts drive conversions.
Why It's Great for Ecommerce Stores
Revenue tells you what happened, but it doesn't explain why it happened. That's where GA4 excels.
Instead of simply reporting sales, GA4 helps uncover how shoppers interact with your store before making a purchase. You can identify which traffic sources bring qualified visitors, where customers abandon the buying journey, which landing pages convert best, and how different devices influence purchasing behavior.
For ecommerce brands looking to improve conversion rates, optimize marketing funnels, or better understand customer behavior, GA4 provides the data needed to make informed decisions.
Key Features
- Event-based tracking: Measure every important customer interaction, from page views and scrolls to add-to-cart events and purchases.
- Ecommerce reporting: Track product views, checkout steps, transactions, revenue, and shopping behavior.
- Traffic source analysis: See which channels, campaigns, and keywords drive the most valuable visitors.
- Funnel exploration: Visualize where users drop off throughout the purchase journey.
- Audience segmentation: Build custom audiences based on user behavior for deeper analysis and remarketing.
- Cross-device measurement: Understand how customers move between desktop, mobile, and apps before converting.
- Custom reports and Explorations: Create tailored reports to answer specific business questions.
Pros
- Free for most ecommerce businesses
- Industry-standard analytics platform with extensive documentation
- Powerful customer journey and conversion funnel analysis
- Integrates seamlessly with Google Ads and other Google products
- Highly customizable for businesses with advanced reporting needs
Cons
- Steeper learning curve than previous versions of Google Analytics
- Requires proper event configuration to unlock its full value
- Focuses on user behavior rather than profit or financial metrics
- Reporting can feel overwhelming for beginners
Pricing
Google Analytics 4 is free for the vast majority of businesses.
Best For
Ecommerce businesses of all sizes that want to understand how customers find, navigate, and convert on their store, making it an essential tool for improving user experience and conversion rates.
User Reviews
According to James Wilson: “Great analytics platform for tracking website and ecommerce performance. It offers detailed reports and powerful insights into user behavior, but the interface can be confusing for beginners.”

19 Essential Ecommerce KPIs to Track on Your Dashboard
A comprehensive ecommerce analytics dashboard typically includes metrics across four key areas:
- Sales & revenue: Revenue, orders, AOV, and sales trends.
- Marketing performance: Traffic, ROAS, CAC, and channel performance.
- Customer insights: Conversion rate, repeat purchase rate, customer lifetime value (CLV), and retention.
- Operations & profitability: COGS, shipping costs, refunds, inventory, and net profit.
KPI | What it tells you |
|---|---|
Measures your overall sales performance over a selected period. Tracking revenue trends helps evaluate business growth and seasonality. | |
Shows how much profit your business keeps after accounting for COGS, shipping, ad spend, transaction fees, and other operating costs. | |
Indicates how much customers spend per order and helps evaluate upsell and cross-sell strategies. | |
Reveals how much revenue remains after product costs, helping assess pricing and overall profitability. | |
Shows whether your business is growing or slowing down over time by tracking daily, MoM, or YoY revenue trends. | |
Measures how much it costs to acquire a new customer. Lower CAC generally means more efficient marketing. | |
Evaluates advertising efficiency, but should always be considered alongside profit, not just revenue. | |
Traffic by Source | Identifies which channels drive the most valuable visitors and helps optimize your marketing mix. |
Blended CAC | Calculates customer acquisition cost across all marketing channels, providing a more complete picture than channel-level CAC alone. |
Marketing Efficiency Ratio (MER) | Measures total revenue generated for every dollar spent on marketing, offering a broader view than ROAS. |
Measures the percentage of visitors who complete a purchase. Higher conversion means more revenue from existing traffic. | |
Cart Abandonment Rate | Highlights where shoppers leave before completing a purchase. Around 70% is common across ecommerce. |
Checkout Completion Rate | Measures how many shoppers complete checkout after initiating it, helping identify checkout friction. |
New vs. Returning Customers | Shows the balance between customer acquisition and loyalty, helping evaluate sustainable growth. |
Estimates the total revenue a customer generates over their relationship with your business, helping guide acquisition spending. | |
Compares customer value to acquisition cost. A ratio around 3:1 is generally considered healthy for growing ecommerce brands. | |
Repeat Purchase Rate | Indicates customer loyalty and the effectiveness of your retention strategy. |
Customer Retention Rate | Measures the percentage of customers who continue buying from your store over time. |
Shows the percentage of customers you lose during a given period, helping identify retention issues. |
Based on what we've seen across thousands of Shopify stores, TrueProfit recommends prioritizing a small set of profit-focused KPIs instead of tracking every available metric. Start with Net Revenue, Net Profit, Gross Margin, AOV, CAC, ROAS, Conversion Rate, and LTV:CAC Ratio, they provide the clearest picture of business performance while keeping your dashboard actionable.
Which KPIs Matter Most for Your Business Stage?
One mistake I see quite often is merchants trying to monitor every metric available in their dashboard. In reality, the most important KPIs change as your business grows. To make things easier, here's a summary of the key KPIs to focus on at each stage of business growth.
Stage | Priority KPIs |
|---|---|
Early (0 to $10K/month) | Conversion rate, CAC, AOV, net profit |
Growth ($10K to $100K/month) | LTV:CAC ratio, retention rate, ROAS by channel, gross margin, net profit |
Scale ($100K+/month) | Inventory turnover, blended CAC, cohort-based LTV, contribution margin by SKU, net profit |
How to Build an Ecommerce Analytics Dashboard
You don't need a data engineer or a custom BI setup to build a useful dashboard. Most Shopify stores can get something solid running in a few hours. Here's the process:
Step 1: Define your goal
Start with the question you want to answer, such as: "Am I profitable, and what's driving that profit?" Your dashboard should help you make better decisions.
Step 2: Focus on a few key KPIs
Focus on 5–8 metrics that match your business stage. Net profit should always be included.
- Early: Conversion rate, CAC, AOV, net profit
- Growth: LTV:CAC, gross margin, ROAS, net profit
- Scale: Blended CAC, cohort LTV, contribution margin, net profit
Step 3: Choose the right tool
Pick a tool based on your needs. For example, TrueProfit is ideal for Shopify profit tracking, Triple Whale for multi-channel attribution, and Looker Studio for custom reporting.
Step 4: Connect your data
At a minimum, integrate:
- Shopify
- Ad platforms (Meta, Google, TikTok)
- GA4
- COGS and shipping costs
Step 5: Review consistently
Check key metrics daily, review performance weekly, and analyze long-term trends monthly.
Build vs. Buy: What's Better for Your Ecommerce Analytics Dashboard?
Businesses generally have two options: build a custom dashboard from scratch or use a dedicated ecommerce analytics platform. The best choice depends on your budget, technical resources, and reporting needs.
Build | Buy |
|---|---|
Fully customizable | Ready to use with minimal setup |
Connect any data source | Native ecommerce integrations |
Requires technical expertise | No coding or BI knowledge required |
Higher implementation and maintenance costs | Faster and more cost-effective for most stores |
Best for enterprise teams | Best for SMBs and growing ecommerce brands |
Build if...
- You have a dedicated data or BI team.
- Your business requires highly customized reporting.
- You need to combine data from multiple internal systems.
Buy if...
- You want to get started quickly.
- You run a Shopify or DTC ecommerce business.
- You need pre-built dashboards for sales, marketing, customers, and profitability.
- You'd rather focus on growing your store than maintaining reporting infrastructure.
For most ecommerce businesses, buying an analytics platform is the more practical choice. It provides the KPIs, integrations, and reports you need without the time and cost of building a custom solution from scratch.
Final Thoughts
There is no single best ecommerce analytics dashboard for every business. The right choice depends on the questions you're trying to answer, the metrics you care about most, and how much customization you need.
What matters most isn't having access to more data, it's having access to the right data. Start by identifying the KPIs that have the biggest impact on your business, build a dashboard around them, and review it consistently.
For many ecommerce brands, that means looking beyond revenue and focusing on profitability. Understanding how ad spend, product costs, shipping, and other expenses affect your bottom line often provides more actionable insights than sales numbers alone.
Harry Chu is the Founder of TrueProfit, a net profit tracking solution designed to help Shopify merchants gain real-time insights into their actual profits. With 11+ years of experience in eCommerce and technology, his expertise in profit analytics, cost tracking, and data-driven decision-making has made him a trusted voice for thousands of Shopify merchants.