Weighted Average Contribution Margin for Ecommerce: Formula & Strategy

Table of Contents
Most ecommerce stores sell more than one product. And if you're using a single product's contribution margin to make portfolio-level decisions, you're working with an incomplete picture.
The weighted average contribution margin (WACM) blends each product's margin with its share of total sales volume to give you one number that reflects how your entire catalog actually performs. It's how multi-SKU stores connect product-level profitability to real business decisions: breakeven targets, ad spend allocation, product cuts, and pricing reviews.
This guide covers the formula, a step-by-step calculation with an ecommerce example, and how to use WACM to make better decisions across your store.
In this blog:
What Is Weighted Average Contribution Margin?
The weighted average contribution margin is the average contribution margin per unit across all products, adjusted for how much each product contributes to your total sales volume. It's the multi-product version of a standard contribution margin calculation.
For ecommerce stores with multiple SKUs, a standard per-unit contribution margin only tells you about one product in isolation. WACM accounts for the reality that you're selling products at different volumes, prices, and cost structures all at once. It gives you a single, portfolio-level number you can actually act on.
How WACM Differs from Standard Contribution Margin?
The most important difference between standard contribution margin and WACM comes down to scope. Standard contribution margin looks at a single product in isolation. In other words, it tells you how much one item contributes to covering your fixed costs. WACM zooms out and looks at your entire product portfolio at once, giving you a blended picture of profitability across everything you sell.
This matters because the standard contribution margin completely ignores how much of each product you're actually selling. It treats a slow-moving premium item the same as your bestseller, even if one outsells the other ten to one. WACM fixes this by weighting each product's margin according to its share of your total sales volume, so the products that drive most of your revenue have the most influence on the final number.
When it comes to breakeven analysis, standard contribution margin only really works if you're a single-product business. The moment you're selling multiple SKUs, the calculation becomes too simplistic to rely on. WACM was built for exactly this situation; it gives multi-product businesses a single, actionable number they can use to calculate how much revenue they need to cover their fixed costs across the whole business.
Finally, as your sales mix shifts. Let’s say, a cheaper product suddenly starts outselling your premium line, your standard contribution margin stays the same and gives you no warning. WACM moves with your business. When customers start buying differently, your WACM changes to reflect that, which is what makes it a much more honest and useful metric for day-to-day decision making.
Why Sales Mix Changes Everything?
Two products can have identical unit contribution margins, but if one sells five times more than the other, it has a much larger impact on your overall profitability. WACM captures that reality.
For instance, a Shopify store selling a $120 skincare set at a 55% contribution margin alongside a high-volume $15 face wash at a 30% margin can't rely on either number alone. If the face wash makes up 70% of orders, it's driving the store's blended margin more than the skincare set. WACM makes that visible.

Weighted Average Contribution Margin Formula
The WACM formula multiplies each product's unit contribution margin by its share of total unit sales, then sums those figures across all products.
The core formula of average contribution margin is
Where:
- Unit Contribution Margin = Selling Price Per Unit - Variable Cost Per Unit
- Sales Mix % = Units Sold (Product) / Total Units Sold (All Products)
If you already have aggregated totals, you can use a simpler formula:
WACM = Total Contribution Margin / Total Units Sold
This shortcut works when you want a quick overall figure. The full formula is more useful when you need to understand each product's individual contribution to the weighted average.
For ecommerce, variable costs are the costs that scale directly with each sale, these typically include:
- Cost of goods sold (COGS)
- Shipping and fulfillment fees
- Payment processing fees (usually 2–3.5% per transaction)
- Per-click or per-sale ad spend
- Marketplace fees (Amazon, Etsy, etc.) if applicable
Fixed costs such as rent, salaries, software subscriptions, and agency retainers are excluded from the contribution margin calculation entirely. Getting this classification right matters: misidentifying a fixed cost as variable (or vice versa) will skew your WACM and the decisions you make from it.
How to Calculate Weighted Average Contribution Margin
Calculating WACM comes down to three core steps: finding how much each product contributes per sale, understanding how much each product represents in your overall sales volume, and then blending those two figures together into a single, meaningful number. Here's how to work through each one.
Step 1: Calculate Each Product's Unit Contribution Margin
Start with the basics. For each product you sell, subtract its variable cost per unit from its selling price. Variable costs are anything that scales directly with production or fulfillment — think raw materials, packaging, payment processing fees, and outbound shipping.
The result tells you exactly how much revenue is left over from each sale before your fixed costs enter the picture. A product with a high unit CM isn't necessarily your best performer though — that depends on how often it actually sells, which is where the next step comes in.
Step 2: Determine Each Product's Sales Mix Percentage
Your sales mix reflects how your total revenue or unit volume is distributed across your product lineup. To calculate it, divide the number of units sold for a given product by the total units sold across all products during the same period.
This is the weighting mechanism at the heart of WACM. A product that makes up 60% of your sales volume will have far more influence on your overall margin than one that accounts for just 10%, even if that smaller product has a higher individual contribution margin.
Step 3: Apply the Weighted Average Formula
Once you have the unit CM and sales mix percentage for each product, multiply them together, then sum the results across your entire product range.
What you're left with is a single margin figure that reflects your actual business — not just the margin of your best product or your worst, but a true weighted average that accounts for what you're really selling and in what proportions.
Practical Example: Calculating WACM for an Ecommerce Retailer
Let's say you run an online store selling three products: a $50 water bottle, a $120 backpack, and a $30 phone case. After subtracting variable costs like manufacturing, packaging, and shipping, your contribution margins are 60%, 55%, and 40% respectively.
Now, if your monthly revenue split is 50% from the water bottle, 30% from the backpack, and 20% from the phone case, your Weighted Average Contribution Margin would be: (0.60 × 0.50) + (0.55 × 0.30) + (0.40 × 0.20) = 0.30 + 0.165 + 0.08 = 54.5%.
This means that for every dollar of revenue your store generates, roughly 54.5 cents are available to cover fixed costs and contribute to profit. If that number starts creeping down over time, it's often a signal that your lower-margin products are eating into your sales mix and it may be time to rethink your promotions, pricing, or product focus.

How WACM Informs Ecommerce Strategy
WACM is most valuable when used to make active decisions about your product catalog, not just to report historical performance.
1. Evaluating Sales Mix Shifts
Because WACM is directly tied to your sales mix, any shift in what sells most changes your overall margin. Ecommerce stores can use this proactively.
If Gadget Central ran a paid campaign that shifted 10% of accessory sales toward tablets, the WACM would rise because tablets carry a higher unit margin. Modeling this before committing ad spend lets you estimate margin impact alongside revenue projections, not just after the fact.
2. Deciding Which Products to Push
Products with high unit contribution margins that make up a small share of orders are often underleveraged. WACM analysis helps identify where increased marketing investment would have the biggest impact on overall profitability, not just topline revenue.
This is where WACM connects directly to net profit: pushing higher-margin products doesn't just improve your blended margin, it accelerates how quickly fixed costs are covered and real profit accumulates. For Shopify sellers, tools like TrueProfit surface this kind of per-product profitability data in real time, so you're not relying on manual spreadsheet calculations after the month closes.
3. Pricing and Discount Decisions
WACM gives you a baseline for pricing reviews. If you're considering a sitewide sale or a discount on a high-volume product, you can calculate how much the volume increase needs to be in order to maintain the same overall WACM. Without this, discount decisions are made on revenue assumptions that ignore the margin cost entirely.
This matters most during peak ecommerce periods like Black Friday, where discounts can erode margins faster than volume gains recover them.
4. Product Discontinuation
Products with low unit contribution margins and low sales volume contribute very little to WACM. Cutting them simplifies your catalog without meaningfully hurting profitability. If a product also requires disproportionate inventory holding, customer support load, or dedicated ad spend, the case for discontinuation is stronger. The profit vs. revenue framing matters here: a product can generate revenue while dragging your overall margin down.
WACM vs. Other Profitability Metrics
WACM sits alongside several other key metrics. Understanding how they relate helps you use each one correctly.
Metric | What It Measures | Fixed Costs Included? | Multi-Product? |
|---|---|---|---|
Unit Contribution Margin | Profitability of one product per unit | No | No |
Weighted Average CM | Blended profitability across all products | No | Yes |
Revenue minus COGS as a % of revenue | Partially (via COGS) | Yes | |
Final profitability after all costs | Yes | Yes |
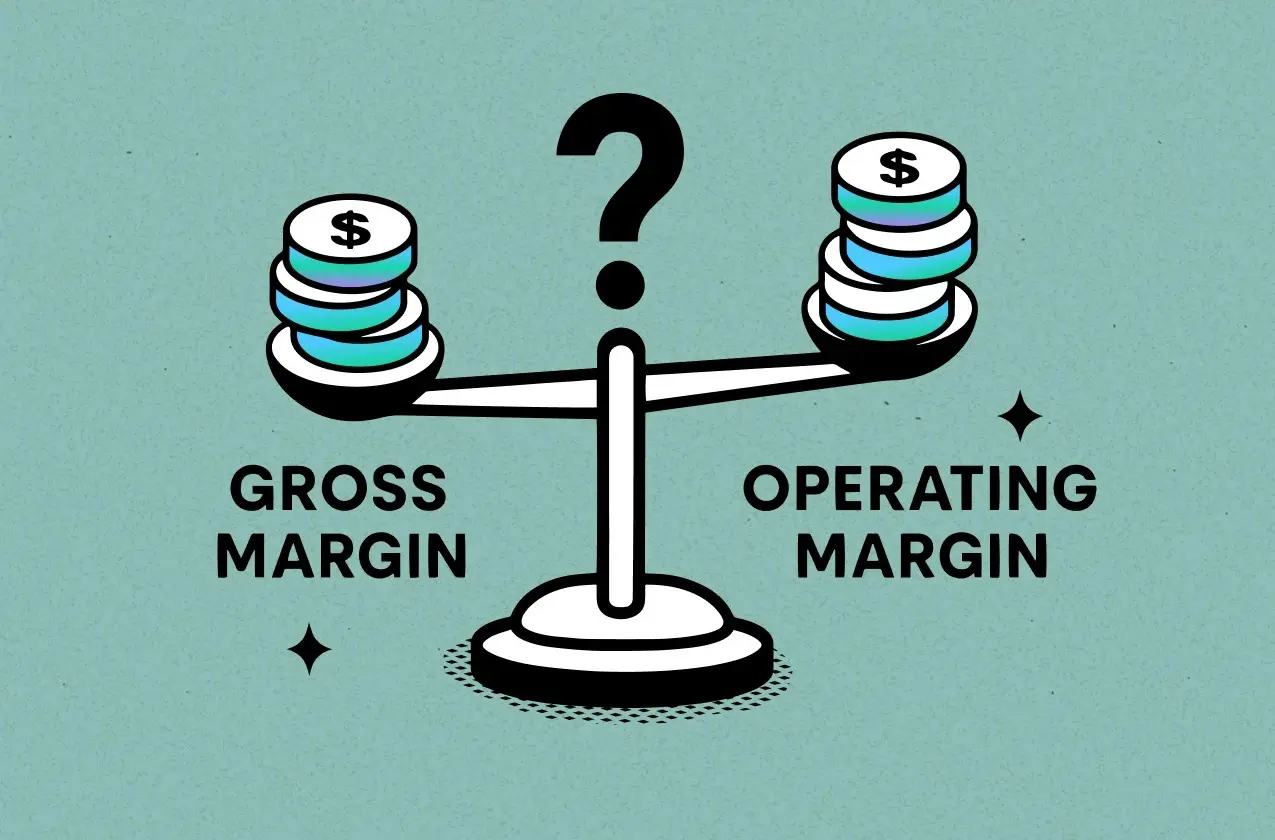
WACM and gross margin are often confused. Gross margin uses COGS, which can include fixed manufacturing overhead. WACM uses only variable costs, making it a cleaner measure for operational decisions.
For a complete picture of business health, WACM works best alongside your P&L statement, which captures fixed costs, operating expenses, and taxes that WACM intentionally excludes.
Limitations of WACM for Ecommerce Stores
WACM is a useful tool, but it comes with assumptions that can limit its accuracy in practice.
1. It Assumes a Stable Sales Mix
WACM is calculated using a specific sales mix at a specific point in time. Ecommerce sales mixes are rarely stable. Seasonality, viral products, ad campaign results, and platform algorithm changes can all shift your mix significantly week to week.
A store that sees strong Q4 demand for gift bundles but steady year-round basics will have a very different WACM in November than in March. Using an annual WACM for monthly breakeven planning leads to flawed targets. Recalculate per period when your catalog has meaningful seasonality.
2. It Requires Clean Cost Classification
WACM depends on accurately separating variable and fixed costs. In ecommerce, some costs sit in a grey zone. A 3PL warehouse fee might be partly fixed (monthly minimum) and partly variable (per pick and pack). Influencer partnerships billed per post could be semi-fixed. Misclassifying these distorts your WACM and any decisions built on it.
3. It Doesn't Capture Return Rates or Hidden Costs
WACM uses revenue and variable costs at the point of sale. It doesn't automatically account for return rates, which for ecommerce can run 15–30% in categories like apparel and electronics. A product with a strong unit CM but a 25% return rate has a much weaker real margin than WACM alone suggests. Factor return costs in as a variable cost per unit where your data supports it.
How to Calculate WACM in Excel
Excel is a practical tool for WACM, especially if you're doing scenario analysis across different sales mix assumptions.
Here is how to set it up in excel:
Step 1: List each product in a separate row.
Step 2: Create columns for: Selling Price, Variable Cost Per Unit, Units Sold.
Step 3: Add a Unit CM column: =Selling Price - Variable Cost
Step 4: Add a Total Units cell: =SUM(Units Sold column)
Step 5: Add a Sales Mix % column: =Product Units / Total Units (format as percentage)
Step 6: Add a Weighted CM column: =Unit CM × Sales Mix %
Step 7: Sum the Weighted CM column. That total is your WACM.
Once the template is set up, you can run scenarios by adjusting units sold for each product and watching how WACM shifts in real time.
Final Thoughts
WACM is one of the most useful numbers an ecommerce store can track, and one of the most underused.
Most store owners know their best-selling products. Fewer know whether those products are actually driving profitability or just driving volume. WACM closes that gap. It forces you to look at your catalog as a system, not a collection of individual SKUs, and connects the everyday decisions you make (which products to push, how deep to discount, what to cut) to their real margin impact.
The calculation isn't complicated. What's harder is building the habit of checking it regularly and acting on what it tells you. If your WACM is trending down, something in your mix has shifted, and the sooner you catch it, the less damage it does.
But WACM is one piece of the puzzle. It doesn't include fixed costs, and it doesn't tell you whether the overall business is profitable. That's what net profit margin is for. If you want to track both in one place without the manual work, TrueProfit gives you a live view of your margins, costs, and net profit as orders come in if you’re running a Shopify business, so nothing slips through the cracks.


Harry Chu is the Founder of TrueProfit, a net profit tracking solution designed to help Shopify merchants gain real-time insights into their actual profits. With 11+ years of experience in eCommerce and technology, his expertise in profit analytics, cost tracking, and data-driven decision-making has made him a trusted voice for thousands of Shopify merchants.