Operating Expenses: Definition, Real Examples, and Ecommerce Benchmarks
Table of Contents
Operating expenses are one of the most important, but often most overlooked, parts of running a business. While revenue usually gets the spotlight, it’s your operating expenses that quietly determine whether your business is actually profitable or just busy.
OpEx covers everything it costs to run your store outside of making the product: ads, payroll, software tools, fulfillment, and rent. And in ecommerce especially, these costs can scale quickly as your store grows.
This guide covers what operating expenses are, how to calculate them, and where ecommerce brands typically land on benchmarks.
In this blog:
What Are Operating Expenses (OpEx)?
Operating expenses (OpEx) are the ongoing costs required to run your business, excluding the direct costs of producing your products (COGS) and any non-operating costs like taxes or financing.
These are the everyday expenses that keep your ecommerce store running, such as ads, software tools, fulfillment, salaries, payment fees, rent, and office costs. While revenue shows how much you are selling, OpEx shows how much of that revenue is actually being spent to operate the business.
Tracking OpEx is one of the clearest ways to understand where your money goes and whether your margins are holding up.
Examples of Operating Expenses
Here are common examples of operating expenses in a business:
- Salaries, wages, and employee benefits
- Utilities such as water and electricity
- Rent and lease payments
- Office supplies and equipment
- Software licenses and subscription tools
- Marketing and advertising costs
- Travel expenses
- Professional fees (e.g., accountant or legal services)
- Depreciation and amortization
- Insurance
- Bank fees and payment processing charges
- Training and employee development costs
- Shipping and delivery costs
- Inventory-related storage fees
- Cleaning services
- Security services
- Meals and entertainment expenses
Fixed and variable operating expenses
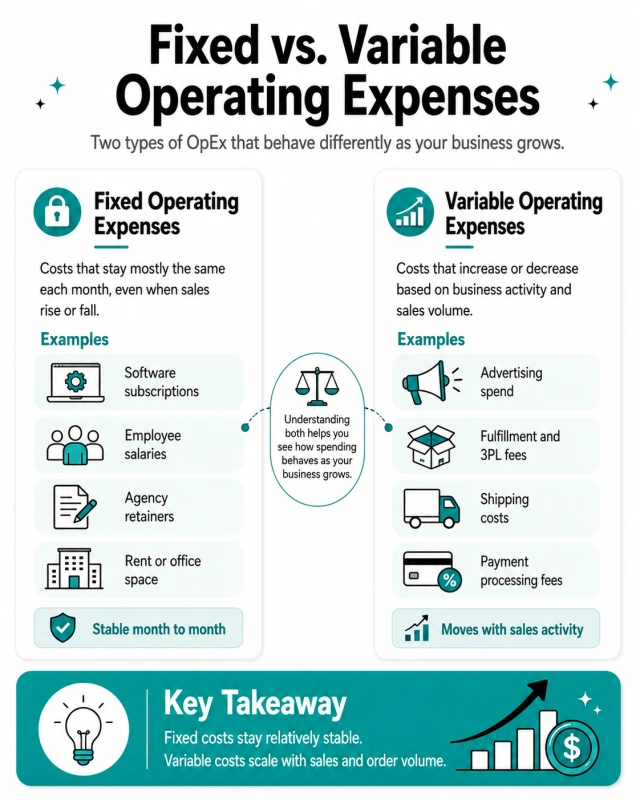
Operating expenses can usually be divided into two main groups: fixed and variable costs. Understanding both helps you see how your spending behaves as your business grows.
Fixed operating expenses are costs that stay mostly the same every month. They do not change much even if your sales go up or down. Common examples include:
- Software subscriptions
- Employee salaries
- Agency retainers
- Rent or office space
Variable operating expenses, on the other hand, change depending on how much business activity you have. When sales increase, these costs usually increase as well. This includes:
- Advertising spend
- Fulfillment and 3PL fees
- Shipping costs
- Payment processing fees

The Operating Expenses Formula
There are two common ways to calculate OpEx:
Or, if you already have your P&L Report:
Both give you the same result. The second option is usually faster when reviewing a P&L.
A Simple Ecommerce Example
Say you run a skincare DTC brand and last month looked like this:
Line Item | Amount |
|---|---|
Revenue | $100,000 |
COGS (product + inbound shipping) | $30,000 |
Gross Profit | $70,000 |
Meta + Google ads | $25,000 |
Shopify + apps | $1,200 |
Payment processing fees | $2,900 |
3PL fulfillment | $6,000 |
Salaries (you + VA) | $8,000 |
Klaviyo, Canva, misc software | $400 |
Total Operating Expenses | $43,500 |
Operating Income | $26,500 |
Your OpEx ratio is 43.5%, which is common for a sub-$1M skincare brand. This number shows how much of your gross profit is actually consumed by running the business.
For a deeper understanding of where operating profit fits among other profit metrics, see the operating profit vs gross profit breakdown.

Comparing OpEx with CapEx, COGS, and More
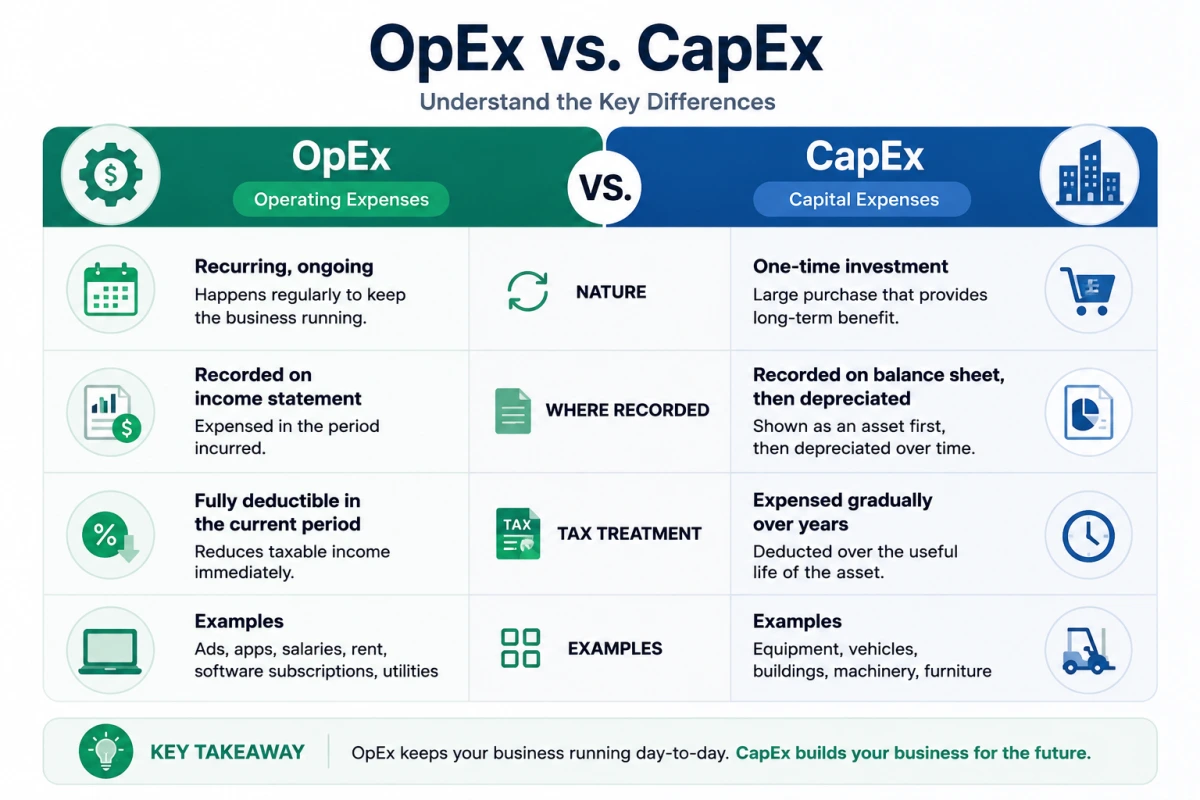
OpEx vs. CapEx
Operating expenses (OpEx) are costs that happen regularly and are fully recorded in the period they occur. Capital expenses (CapEx) are one-time investments in long-term assets that get depreciated over time.
For example, buying a $40,000 packaging machine is CapEx. It becomes an asset on the balance sheet and is spread out over several years through depreciation. On the other hand, paying $400 per month for software that runs that machine is OpEx, because it is recurring and fully expensed immediately.
OpEx vs. COGS
COGS (Cost of Goods Sold) refers to the direct cost of producing or sourcing the products you sell. OpEx is everything needed to run the business that sells those products.
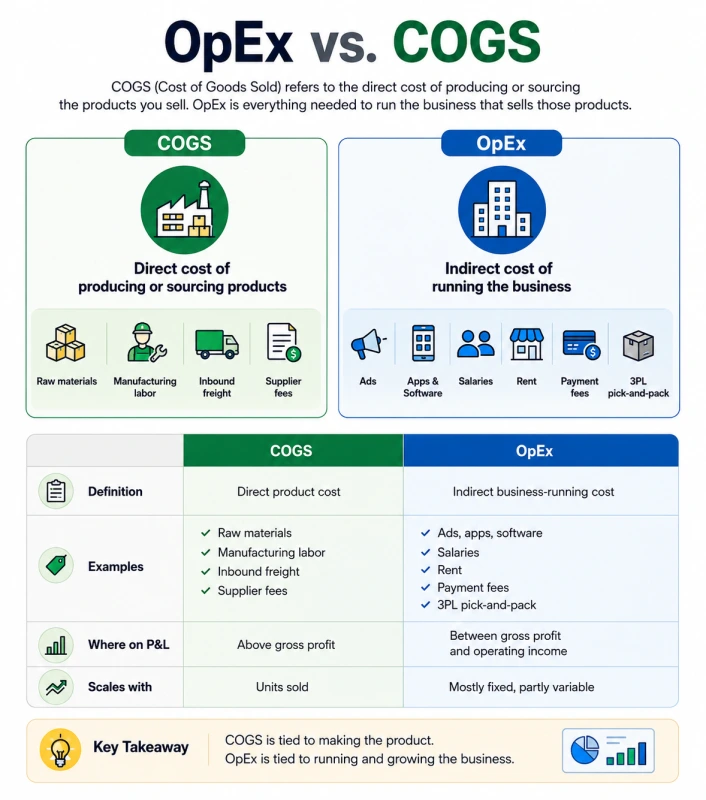
The fast test is: if you sold zero units this month, would the cost still happen? If yes, it's OpEx. If not, it's COGS.
For a fuller treatment of how this affects margin math, the gross profit explainer covers it well.
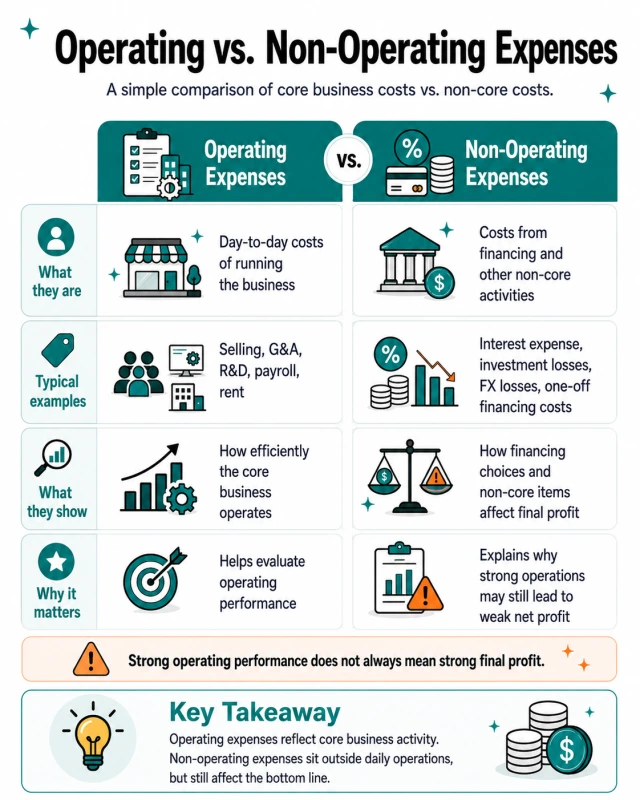
Operating vs. Non-Operating Expenses
Operating expenses are tied to your core business activities. Non-operating expenses come from financing decisions, investments, or one-time events.
Operating Expenses | Non-Operating Expenses |
|---|---|
Related to core business operations | Not related to core operations |
Day-to-day running costs | Financing or one-time events |
Included in operating income calculation | Shown below operating income |
Examples: ads, salaries, software, rent, logistics | Examples: interest on debt, asset sales gain/loss, lawsuits, inventory write-offs |
Operating vs. Non-Operating Expenses on the P&L Report
The P&L report is structured deliberately to separate these:
Revenue − COGS
= Gross Profit − Operating Expenses (Selling + G&A + R&D)
= Operating Income (EBIT) − Non-Operating Expenses (interest, investment losses) + Non-Operating Income
= Pre-Tax Income − Income Taxes
= Net Income
This structure exists for a reason: investors, lenders, and you-as-operators want to see operating performance separately from financing choices. If your operating income is great but your net income is bad because you took on too much debt, that's a financing problem, not a store problem.
For more on how this layers up, the breakdown of P&L vs income statement is worth a read.
Are You Spending Too Much? (2026 Ecommerce Benchmarks)
Most healthy ecommerce brands run total OpEx between 25–40% of revenue, with high-growth brands pushing 45–55% to fund customer acquisition. Above 55% sustained, something is broken.
Here's what the latest 2026 data shows:
Source / Cohort | OpEx Indicator | 2026 Benchmark |
|---|---|---|
Total OpEx as % of revenue | 35–36% | |
Median fixed marketing as % revenue at $50M+ | 1.66% | |
Median CAC | $156 (avg $242) | |
Healthy net profit margin | 15–30% |
For context on how OpEx flows into the rest of your margin stack, the contribution margin and net profit margin breakdowns pair well with this section.
Strategies for Managing OpEx Successfully For Ecom Sellers
Gain real-time visibility into spending
A lot of ecommerce brands only look at their expenses at the end of the month. By that time, the money is already spent, and it is often too late to fix anything.
A better approach is to track spending in real time across all areas of the business, including ads, software tools, fulfillment, and payroll. When you can see this clearly every day, it becomes much easier to notice when costs start to drift out of control.
Automate expense tracking and categorization with a right tool
Manually tracking expenses usually leads to mistakes or missing data. It also takes a lot of time that could be used for more important work.
When expense tracking is automated, the data is more reliable and easier to understand. It also helps you see your net profit more accurately, because everything is updated continuously instead of being patched together at the end of the month.
This is where TrueProfit comes in. It helps ecommerce sellers track all their expenses in one place, whether they are operating expenses or non-operating costs. Instead of dealing with spreadsheets, manual updates, or scattered reports, everything is automatically tracked and categorized in real time.
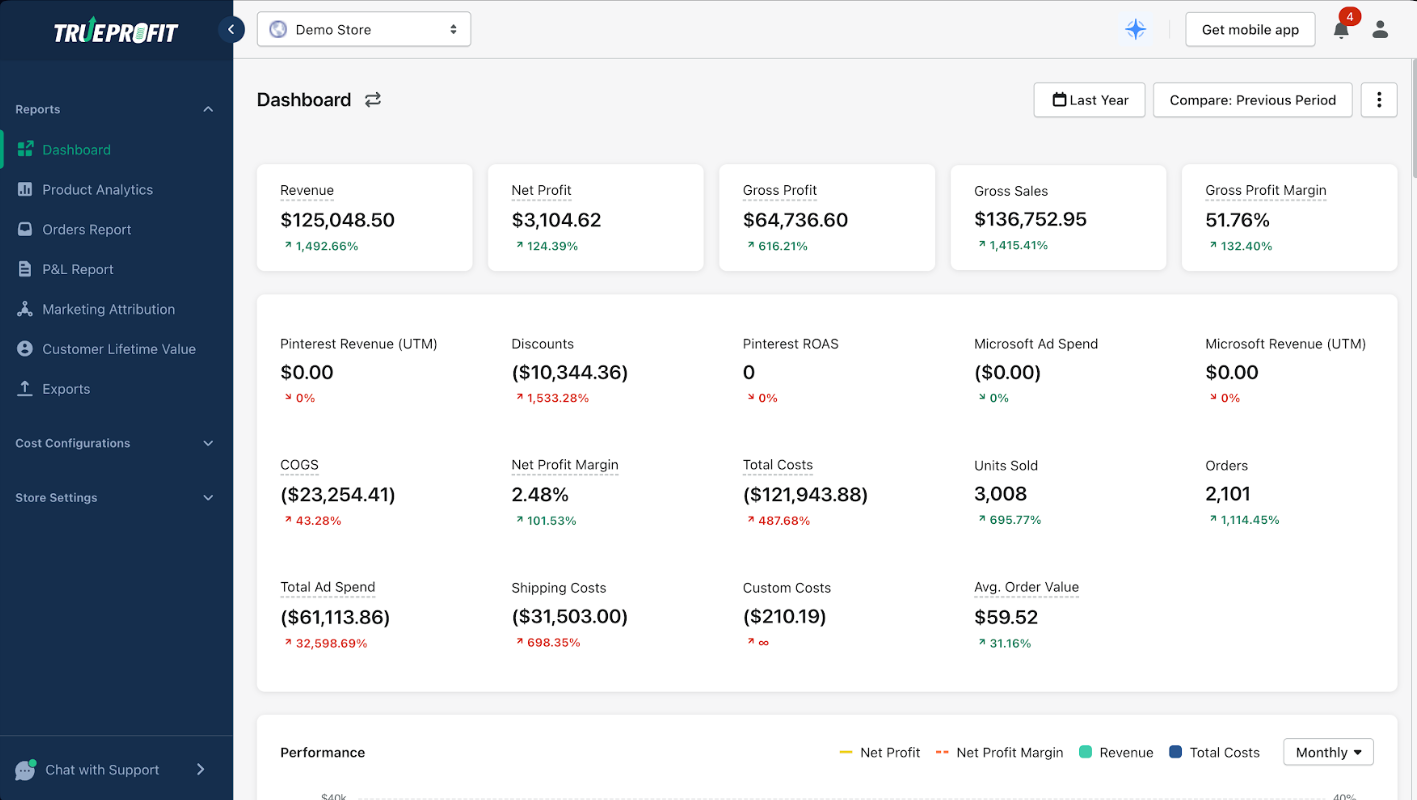
This gives you a clear, complete picture of how your business is really performing. More importantly, it shifts your focus away from surface-level numbers like revenue and helps you understand what actually matters: your bottom-line net profit.

Final Thoughts
Operating expenses are the backbone of how a business actually runs, even though they’re often less visible than revenue or sales. From payroll and marketing to software subscriptions, rent, shipping, and administrative costs, OpEx represents everything needed to keep daily operations moving.
A business can have strong sales and still struggle if operating expenses are too high or poorly managed. When OpEx is tracked clearly and consistently, it becomes much easier to control spending, improve efficiency, and protect margins.
But even with careful tracking, OpEx is only one part of the full picture. True profitability comes from connecting all your financial data like revenue, COGS, ad spend, fees, and operating costs into one clear view. That’s where tools like TrueProfit help ecommerce brands like you go beyond surface-level numbers and understand their real, net profit in real time, so you’re not just growing revenue, but actually growing what you keep.

Harry Chu is the Founder of TrueProfit, a net profit tracking solution designed to help Shopify merchants gain real-time insights into their actual profits. With 11+ years of experience in eCommerce and technology, his expertise in profit analytics, cost tracking, and data-driven decision-making has made him a trusted voice for thousands of Shopify merchants.