Ecommerce Margin Analysis: Formulas, Benchmarks, and Real Examples (2026)
Table of Contents
Strong margins mean your business runs efficiently. Weak margins reveal cost problems that revenue growth alone won't fix. And for ecommerce brands, where hidden costs pile up fast, this distinction matters more than you'd think.
This guide covers the four major margin types, their formulas, margin benchmarks, and a step-by-step process for running your own analysis.
In this blog:
What Is Margin Analysis?
What It Really Means
Margin analysis is the process of calculating what percentage of revenue a business keeps after specific cost categories are deducted. It's not a one-time calculation. It's an ongoing habit of measuring how efficiently your business converts sales into actual profit.
The output is always a percentage, which makes it easy to compare across time periods, products, channels, and industries.
For ecommerce businesses, margin analysis is especially important because many costs are easy to overlook. Ads, shipping, returns, payment fees, marketplace commissions, discounts, and fulfillment costs can all reduce profit even when revenue is growing.
A margin analysis helps you answer questions like:
- Are your products priced profitably?
- Which products or channels generate the strongest margins?
- Are shipping, ad costs, or returns reducing profit?
- Can your business scale without sacrificing profitability?
- Which products should you promote, improve, or remove?
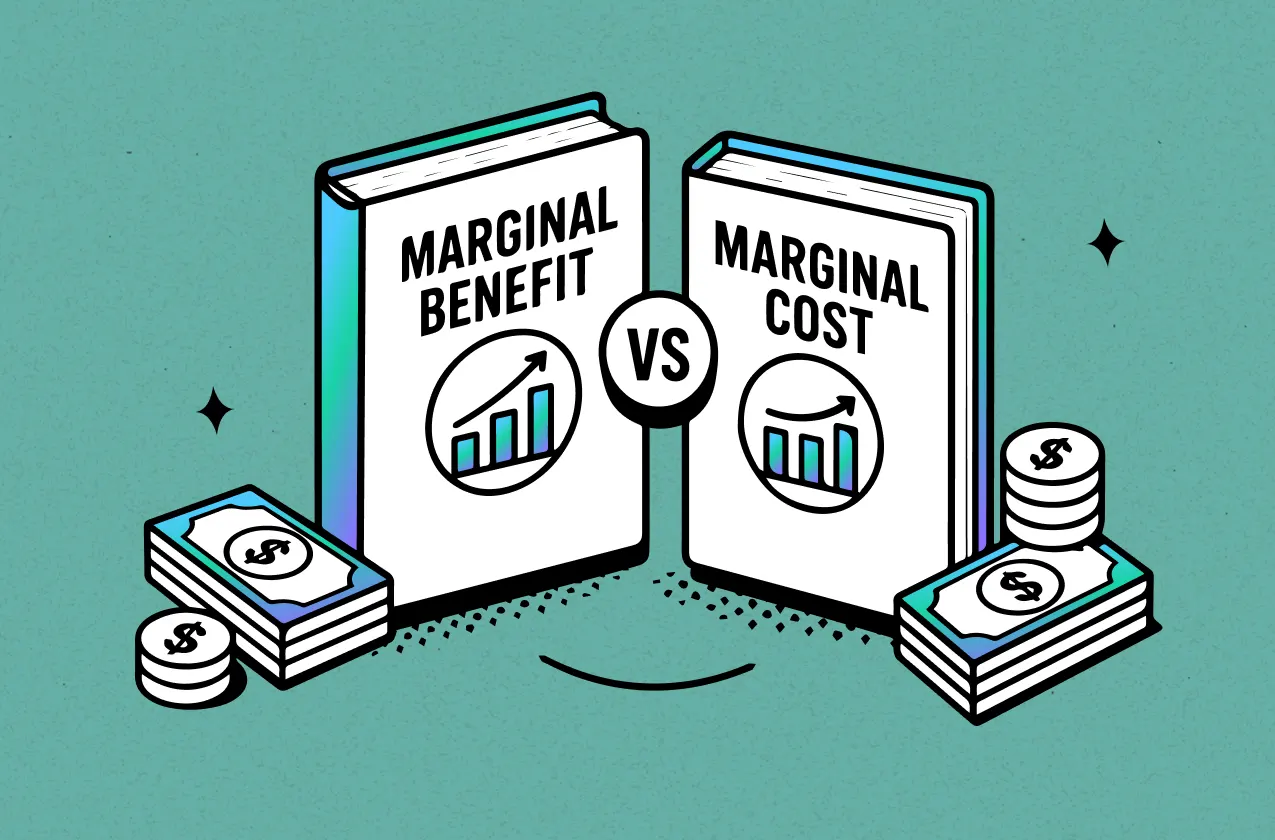
Margin Analysis vs. Marginal Analysis
These two terms are often confused, but they refer to completely different concepts. Margin analysis focuses on evaluating a business’s profit margins and overall profitability.
Marginal analysis, on the other hand, is an economics concept that examines the additional cost and benefit of producing one more unit of output. Although the terms sound similar, they belong to different disciplines and serve very different purposes.

4 Types of Profit Margins and Their Formulas
Each margin type measures profitability at a different level of your PnL statement. Understanding all four gives you the full picture of how your business actually makes (or loses) money. Here’s how they break down:
Margin Type | Formula | What It Measures | Best Used For |
|---|---|---|---|
Gross Profit Margin | (Revenue − COGS) ÷ Revenue × 100 | Profit after product costs (COGS only) | Pricing strategy, supplier negotiation, product viability |
Operating Profit Margin | Operating Income ÷ Revenue × 100 | Profit after all operating expenses (ads, tools, payroll, fulfillment, etc.) | Evaluating business operating efficiency and cost structure |
Net Profit Margin | Net Profit ÷ Revenue × 100 | Final profit after all expenses (tax, interest, etc.) | Overall business health and long-term sustainability |
Contribution Margin | (Revenue − Variable Costs) ÷ Revenue × 100 | Profit per order after variable costs (COGS + shipping + fees + ads) | Scaling decisions, ad optimization, product-level profitability |
1. Gross Profit Margin
Gross profit margin measures the percentage of revenue left after subtracting cost of goods sold, also known as COGS. It shows how efficiently your products turn into gross profit before marketing, operations, and other expenses are included.
For ecommerce owners, gross margin is the first checkpoint of product viability. If your gross margin is too low, you may not have enough room to cover shipping, ad spend, fulfillment, and overhead while still making a profit.
Formula
When to Use It
Use gross profit margin when evaluating product pricing, supplier costs, product sourcing, or whether a product line is worth scaling.
Example
An ecommerce store generates $50,000 in revenue and spends $18,000 on COGS.
Gross Profit Margin = ($50,000 − $18,000) ÷ $50,000 × 100 = 64%
That means $0.64 of every revenue dollar remains after product costs. A healthy gross margin gives you more room to cover marketing, operations, and profit.
For more context, see this guide on what good gross profit margins look like across 5,000+ stores.
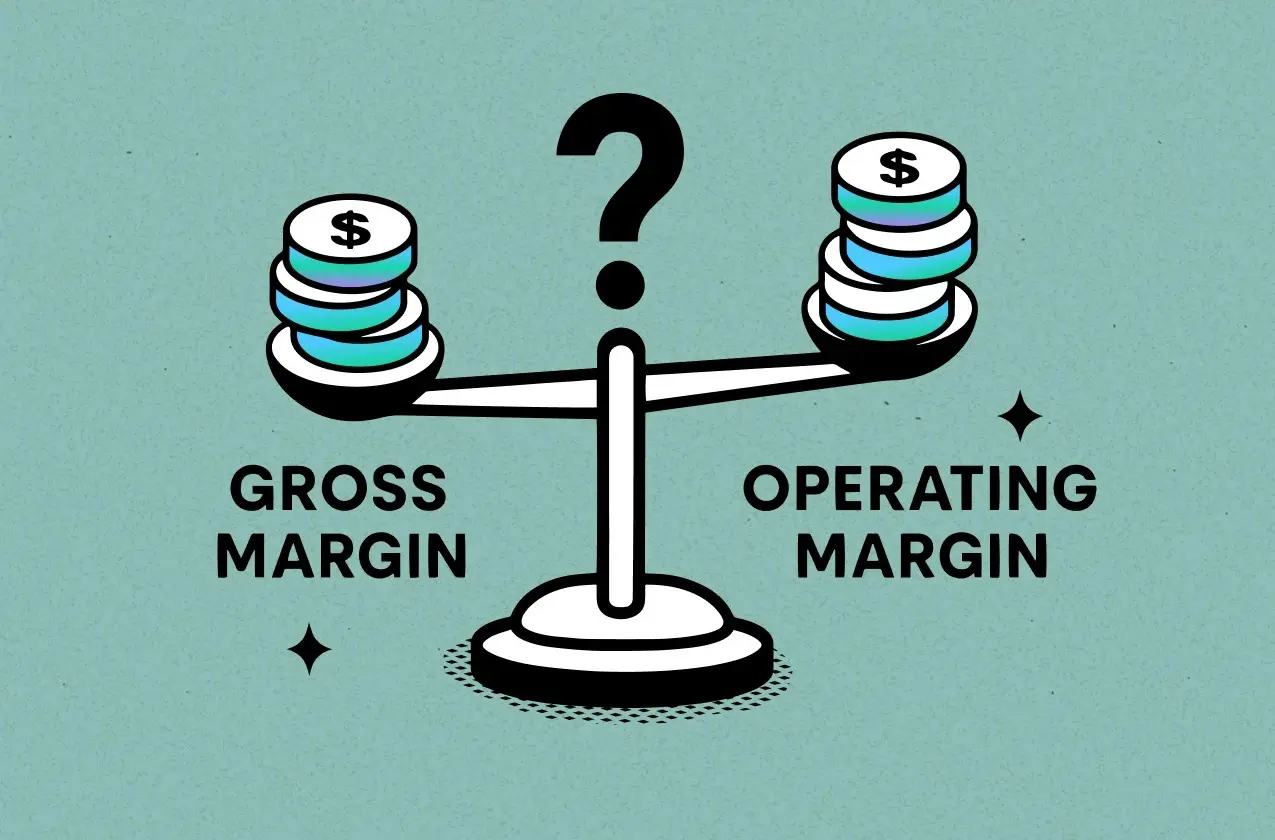
2. Operating Profit Margin
Operating profit margin measures profitability after operating expenses are deducted from gross profit. These expenses may include marketing, payroll, software, fulfillment, platform fees, rent, and other costs required to run the business.
This margin helps you understand whether your business operations are efficient. A store may have a strong gross margin but a weak operating margin if overhead, marketing spend, or fulfillment costs are too high.
Formula
When to Use It
Use operating profit margin to evaluate overall business efficiency, cost structure, and whether your operations are sustainable as revenue grows.
Example
Continuing the previous example, the store has $50,000 in revenue and $32,000 in gross profit after COGS. It then spends $22,000 on operating expenses.
Operating Income = $32,000 − $22,000 = $10,000
Operating Profit Margin = $10,000 ÷ $50,000 × 100 = 20%
That means the business keeps 20% of revenue as operating profit before taxes, interest, and other non-operating expenses.
For a deeper comparison, see this guide on gross margin vs. operating margin.
3. Net Profit Margin
Net profit margin is the bottom-line profitability metric. It shows how much revenue remains after all expenses are deducted, including COGS, operating expenses, taxes, interest, and other costs.
This is one of the clearest indicators of overall business health because it shows how much profit the business actually keeps.
Formula
When to Use It
Use net profit margin to evaluate overall financial health (your bottom line), long-term sustainability, and whether the business is truly profitable after all costs.
Example
Continuing the same example, the store has $10,000 in operating income. After $2,000 in taxes and interest, net income is $8,000.
Net Profit Margin = $8,000 ÷ $50,000 × 100 = 16%
That means the business keeps $0.16 of every revenue dollar as final profit.
Net profit margin answers the most important profitability question: after everything is paid, how much does your business actually keep?
4. Contribution Margin
Contribution margin measures how much revenue remains after variable costs are deducted. Variable costs are expenses that change with sales volume, such as product costs, shipping, transaction fees, packaging, fulfillment, and ad spend.
For ecommerce brands, contribution margin is one of the most actionable metrics because it shows whether a product, order, campaign, or channel is profitable before fixed costs are included.
Formula
When to Use It
Use contribution margin at the product, order, campaign, or channel level to decide whether something is worth scaling.
Example
A customer places a $75 order. The variable costs are:
- Product cost: $18
- Shipping: $9
- Transaction fee: $2.25
- Ad spend: $12
Total variable costs are $41.25.
Contribution Margin = ($75 − $41.25) ÷ $75 × 100 = 45%
That means 45% of the order value remains after variable costs.
Why Margin Analysis Matters for Your Business
Margin analysis is one of the most important financial habits for an ecommerce business. Revenue shows how much you sell, but margins show how much you actually keep. Without it, it’s easy to grow sales while profit quietly shrinks.
It shows your true profitability
It shows your true profitability by separating revenue from actual earnings. So you can see how much money your business really keeps after all costs instead of assuming higher revenue means better performance.
For example, a store making $500,000 in revenue at a 3% net margin keeps $15,000, while another making $200,000 at an 18% margin keeps $36,000.
This means the smaller store is actually more profitable, and margin analysis makes this difference clear.
It exposes hidden cost leaks
Costs like shipping, ad CPMs, transaction fees, returns, and supplier price increases often grow slowly and go unnoticed. And revenue reports don’t show this clearly. Margin analysis helps you spot where profit is being lost before it becomes a bigger issue. So you can see exactly which cost is reducing your profit instead of relying on total revenue alone.
It improves pricing and spending decisions
Every decision affects margins. Gross margin helps with pricing, contribution margin shows if ads and products are profitable, and operating margin reflects overall cost efficiency. When you understand these, it becomes easier to decide where to spend and where to cut.
Average Ecommerce Benchmarks for Margin Analysis
Based on data from 5,000+ ecommerce stores analyzed by TrueProfit in 2026, margins in ecommerce don’t follow a single “ideal number.” They shift a lot depending on niche, pricing strategy, and how aggressively a store spends on ads.
So instead of treating benchmarks as strict targets, it’s better to use them as a rough reference for where your store stands.
What we typically see in 2026
- Gross Profit Margin: around 55%–70% for most ecommerce stores
- Contribution Margin: 33-51% is usually needed if you want to scale paid ads comfortably
- Net Profit Margin: often sits around 18%–26% for growing brands
A store with lower margins is not automatically unhealthy, but it needs enough volume and cost control to remain profitable. A store with higher margins may still struggle if fixed costs, ad spend, or returns are too high.
For a more detailed breakdown, see this guide on ecommerce profit margins across key niches.

How to Conduct a Margin Analysis (Step by Step)
Before looking at numbers, it helps to set a clear structure. This keeps the analysis focused and makes the results easier to act on.
1. Select the analysis period
Start by choosing a time period for your analysis. It can be daily, weekly, monthly, or based on a specific campaign.
What matters most is consistency. If the time frame keeps changing, it becomes hard to compare results and see real trends in your margins.
2. Define the unit of analysis and decision scope
Next, you should be clear about what you are analyzing and what decision you want to support.
For example, you might want to know which products are not meeting margin targets, or whether the issue comes from pricing, cost, or product mix.
This will shape your focus:
- Pricing decisions usually rely on gross margin or contribution margin at the SKU level
- Cost-related decisions look more at operating margin and operating expenses
- Portfolio decisions focus on margin by product line, customer, or channel
At the same time, set clear rules for:
- The time period and comparison baseline
- The unit of analysis (SKU, product line, channel, or customer)
- How you define costs like COGS, variable costs, and operating expenses
Without this clarity, margin numbers can easily be misread.
3. Build a consistent data foundation
Before doing any calculations, make sure your data is clean and consistent.
You need revenue and cost data from your main systems, and each margin type should use the right inputs:
- Gross margin uses revenue and COGS
- Contribution margin includes variable costs like shipping, fees, and ads
- Operating margin includes operating expenses
It also helps to validate the data early:
- Check that totals match your P&L for the same period
- Make sure revenue and costs line up correctly
- Use the same rules for any cost allocation
If the data is not consistent, the margin analysis will not be reliable.
4. Run the margin breakdown
Now you can calculate the main margin types to understand profitability at different levels of the business.
- Gross margin shows profit after product costs (COGS)
- Contribution margin shows profit per order after variable costs
- Operating margin shows business efficiency after operating expenses
- Net margin shows final profit after all costs
Each one gives a different view, from product performance to overall business health.
5. Identify what is driving the change
Once you have the results, the next step is to understand why margins are changing.
Break the numbers down by areas like product, customer segment, or channel. This helps you see where the shift is coming from.
Then look at the main drivers:
- Price changes from discounts or promotions
- Volume changes in sales or orders
- Mix shifts toward higher or lower margin products
- Cost changes in ads, shipping, or product sourcing
A simple comparison between two periods is often enough to see the main cause.
6. Compare against benchmarks
After understanding the drivers, compare your results to your plan, forecast, or past performance.
This helps you see whether the changes are expected or a sign of a deeper issue. It also helps separate normal variation from real performance problems.
Further Reading:
7. Turn insights into action
The last step is where margin analysis becomes useful.
You should turn what you learned into clear actions, such as improving pricing, cutting low-margin products, optimizing ad spend, or scaling what is already working.
The goal is simple: make decisions that improve profitability, not just understand the numbers.
If you want a structured way to document all of this, the step-by-step guide to creating a profit and loss statement is a practical companion to this process.
Optimizing Margin Analysis With the Right Tools
Margin analysis becomes significantly more effective when all financial data is consolidated in one place.
But here’s the situation for most merchants today: revenue may live in your ecom platform dashboard, ad costs in Meta and Google, shipping expenses in a fulfillment platform, and transaction fees in payment processors. Pulling everything together manually can be time-consuming and often leads to incomplete or outdated analyses.
This is where having a dedicated profit analytics tool can make a big difference. If you’re running a store on Shopify, TrueProfit is the way to go.
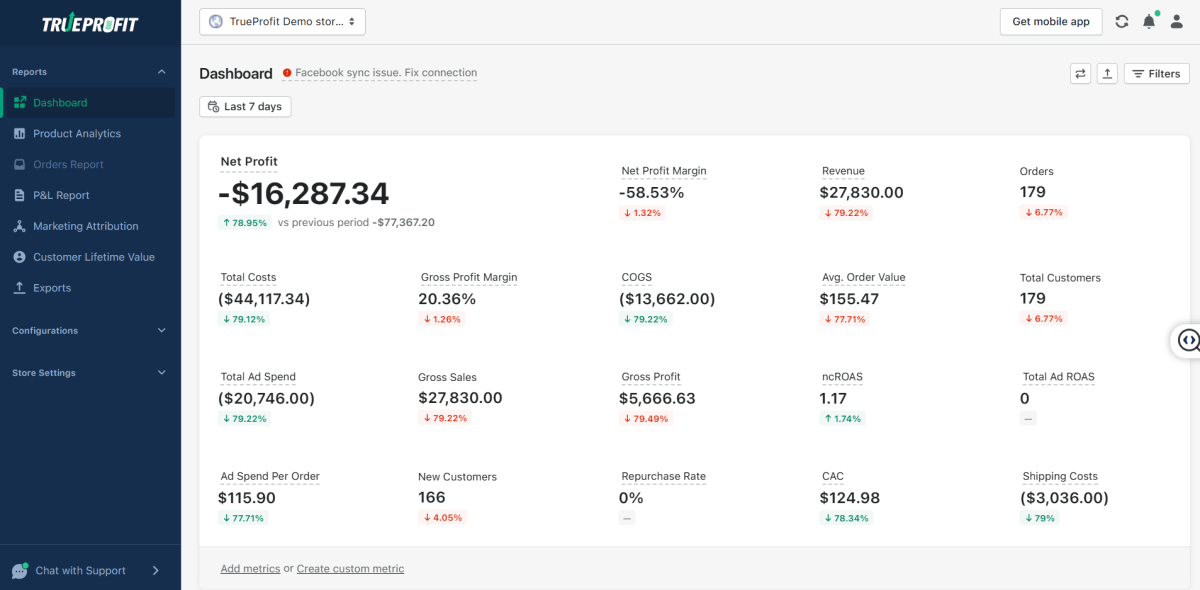
TrueProfit automatically consolidates your revenue, COGS, shipping costs, transaction fees, ad spend, and other expenses into a single dashboard. Instead of manually building spreadsheets, you can track key profitability metrics such as gross profit, contribution margin, and net profit (your bottom line) in real time.
For ecommerce owners, this makes it much easier to identify which products, orders, and marketing channels are driving profit, and which ones are quietly reducing margins.

Final Thoughts
Margin analysis helps ecommerce businesses move beyond revenue and understand what actually drives profit. By tracking gross, operating, net, and contribution margins, you can see where money is being made, where it is being lost, and which areas deserve more attention.
The goal is not to calculate margins once and forget them. The goal is to monitor margins consistently and use the insights to make better decisions about pricing, products, ad spend, operations, and growth.


Harry Chu is the Founder of TrueProfit, a net profit tracking solution designed to help Shopify merchants gain real-time insights into their actual profits. With 11+ years of experience in eCommerce and technology, his expertise in profit analytics, cost tracking, and data-driven decision-making has made him a trusted voice for thousands of Shopify merchants.